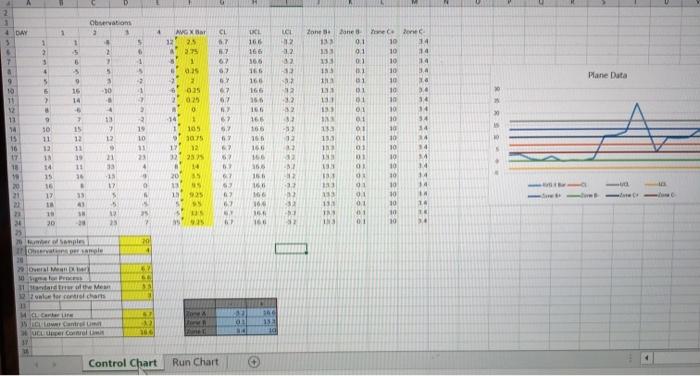
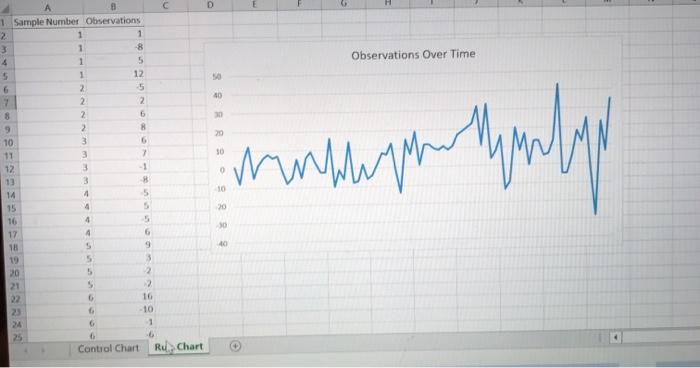
Question: what is your recommendation for the Air Force: pull this altimer for further testing and re-calibration or leave it alone and send it back into

what is your recommendation for the Air Force: pull this altimer for further testing and re-calibration or leave it alone and send it back into the wild blue yonder? base your managerial reccomendation and explanation on BOTH your Control Chart results and your Run Chart results. what is your recommendation for the Air Force:
what is your recommendation for the Air Force:
Overall Objective: Create a Control Chart and a Run Chart: An altimeter is a device on an airplane for measuring the plane's distance above the ground at any given instant. It's obviously a critically important performance and safety instrument. The Air Force does frequent testing on their fighter jet altimeters to ensure they are operating effectively and within statistical control. Your Excel data for this assignment represents the testing of a particular altimeter in a fighter jet over the course of twenty days. Utilizing the data, create a Control Chart and a Run Chart for your altimeter testing on 2 separate worksheets in your workbook. The testing took place over 20 days with 4 observations per day, measuring readout above/below actuals. The process standard deviation for altimeter performance is 6.6 and you will calculate your UCL and LCL with a Z value of 3. Standard Error of the Mean is Sigma/SQRT(# Observations per sample). Control Limits are CL +/- 2 Value Standard Error. Calculate Zones A, B & C for application of Out-of- Control Rules 1-6 from the document called XbarchartRules. 2 Obratom 3 1 4 13 131 nes 113 12 67 4 DAY 3 6 7 1 5 6 1 2 5 4 5 AVGK 25 3.75 1 S 6 1 2 12 12 KI 16 166 366 166 62 CE CE EU FEE FET Bone 01 0.1 0:1 1 31 5 STO 9 9 Pane Data 9 CHE -> 1 166 16 OL 67 EET 1 9 13 166 156 168 165 2 025 025 0 1 105 30 01 01 . 4 13 7 12 PE PE even 10 314 10 14 10 114 10 14 10 wa 10 30 10 10 10 34 10 14 10 10 14 10 10 10 14 133 IN 67 12 32 32 3 -32 02 23 11 12 11 14 15 16 17 18 19 19 13 15 12 9 30 11 12 IN 14 15 10 10 10 01 TE 21 41 CE 07 62 5 25 01 01 19 11 16 166 160 166 165 156 165 VE PE 4 TO SE 133 1 INS 131 131 121 133 131 IN 13 90 01 1 0 OZ EL I OS 20 21 LE 33 18 17 5 5 12 23 299229292 30 41 . 10 10 62 17 1 18 20 16 32 16 18 35 10 160 01 01 10 10 34 6 57 PE C 20 Sample Chopperple 29 20 Dual 10 altor control charts 13 Care 1 Lante Hur Own 1 2 106 0 10 Control Chart Run Chart D Observations Over Time 40 20 mashion Malay 30 C 1 Sample Number Observations 2 1 1 3 1 8 4 1 5 5 1 12 G 2 5 7 2 2 8 2 5 9 2 10 3 6 11 3 12 3 1 13 8 14 4 5 15 4 5 16 5 17 6 18 9 19 5 3 20 5 2 21 5 22 16 25 -10 G 6 Control Chart Ru Chart 0 20 40

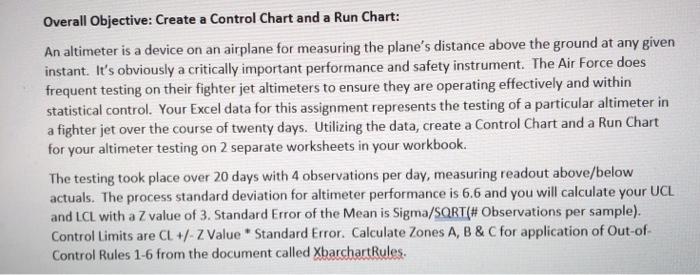
Step by Step Solution

There are 3 Steps involved in it

1 Expert Approved Answer
Step: 1 Unlock blur-text-image
Question Has Been Solved by an Expert!

Get step-by-step solutions from verified subject matter experts

Step: 2 Unlock
Step: 3 Unlock

Students Have Also Explored These Related General Management Questions!