

Question: Question 4 This Test: 70 pts possible Submit Test The following table shows the actual demand observed over the last 11 years: 1 2 3
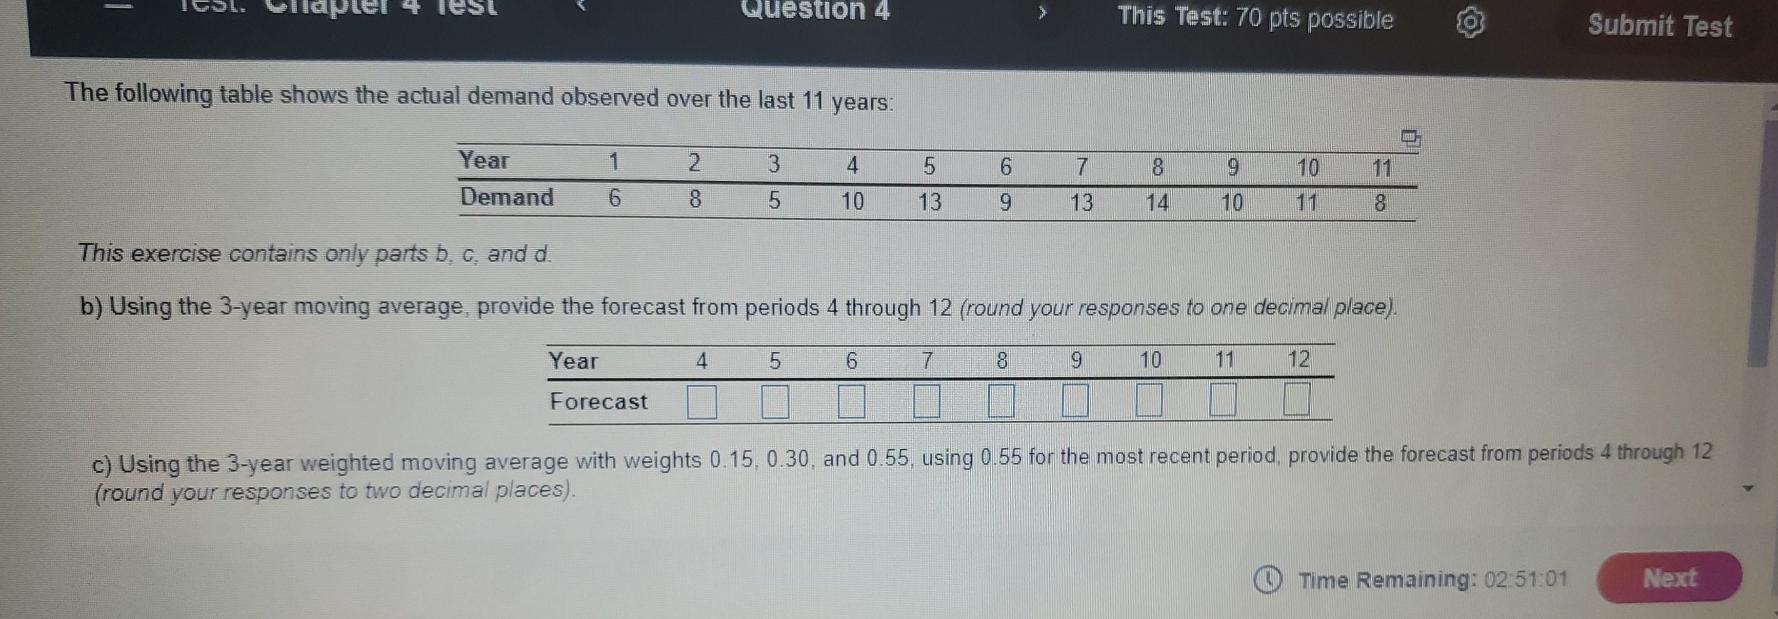
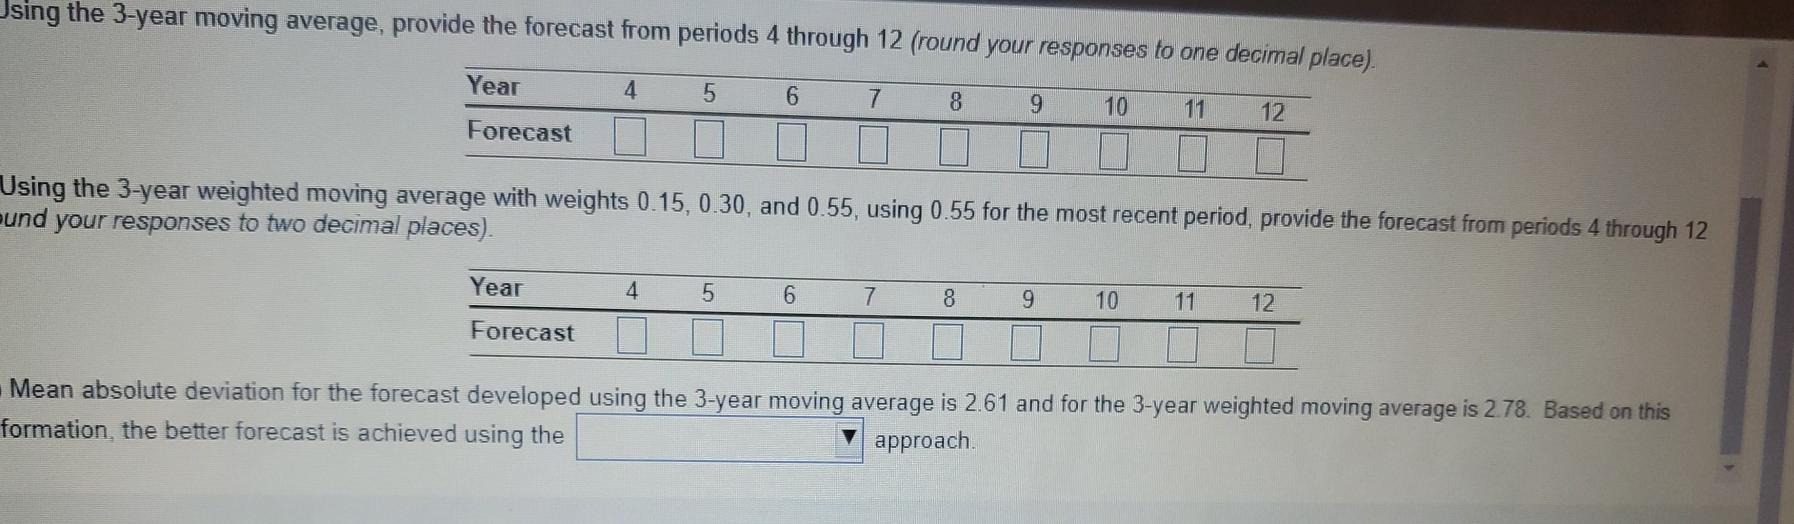
Question 4 This Test: 70 pts possible Submit Test The following table shows the actual demand observed over the last 11 years: 1 2 3 4 6 7 8 9 10 Year Demand 5 13 11 8 6 8 5 10 9 13 14 10 11 This exercise contains only parts b. c. and d. b) Using the 3-year moving average, provide the forecast from periods 4 through 12 (round your responses to one decimal place). Year 4 5 6 7 8 9 10 12 Forecast c) Using the 3-year weighted moving average with weights 0.15.0.30. and 0.55, using 0.55 for the most recent period, provide the forecast from periods 4 through 12 (round your responses to two decimal places). Time Remaining: 02:51:01 Next Jsing the 3-year moving average, provide the forecast from periods 4 through 12 (round your responses to one decimal place). Year 4 5 6 7 8 9 10 11 12 Forecast Using the 3-year weighted moving average with weights 0.15, 0.30, and 0.55, using 0.55 for the most recent period, provide the forecast from periods 4 through 12 und your responses to two decimal places). Year 4 5 6 7 8 9 10 12 Forecast Mean absolute deviation for the forecast developed using the 3-year moving average is 2.61 and for the 3-year weighted moving average is 278. Based on this formation, the better forecast is achieved using the approach
Step by Step Solution
There are 3 Steps involved in it
1 Expert Approved Answer
Step: 1 Unlock

Question Has Been Solved by an Expert!
Get step-by-step solutions from verified subject matter experts
Step: 2 Unlock
Step: 3 Unlock