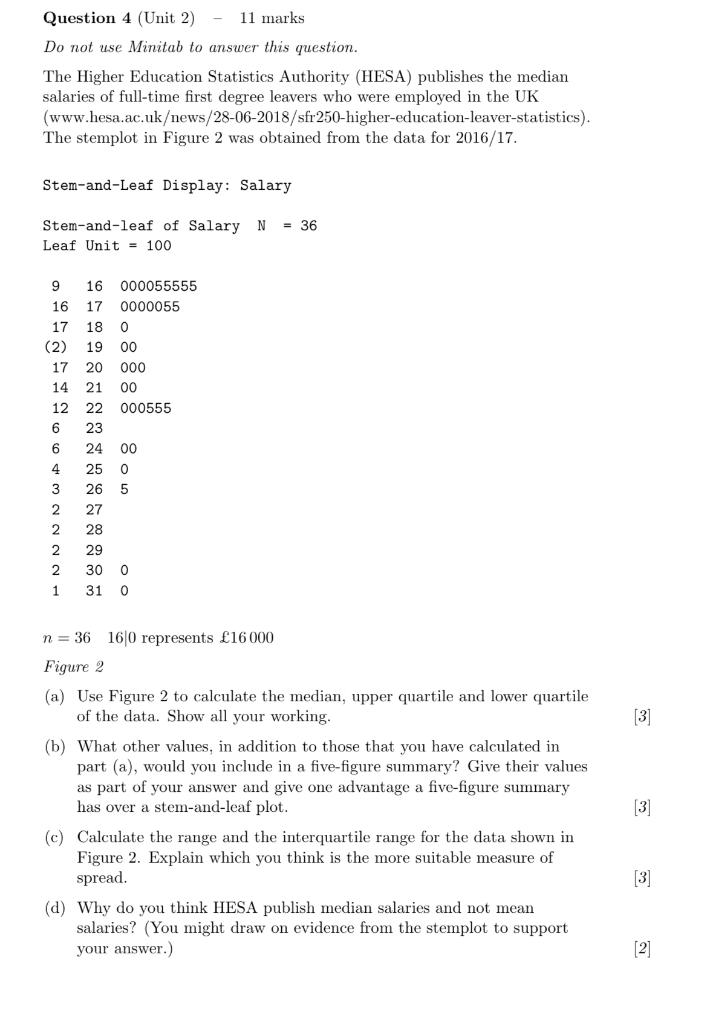
Question: Question 4 (Unit 2) - 11 marks Do not use Minitab to answer this question. The Higher Education Statistics Authority (HESA) publishes the median salaries

Question 4 (Unit 2) - 11 marks Do not use Minitab

Question 4 (Unit 2) - 11 marks Do not use Minitab to answer this question. The Higher Education Statistics Authority (HESA) publishes the median salaries of full-time first degree leavers who were employed in the UK (www.hesa.ac.ukews/28-06-2018/sfr250-higher-education-leaver-statistics). The stemplot in Figure 2 was obtained from the data for 2016/17. Stem-and-Leaf Display: Salary = 36 Stem-and-leaf of Salary N Leaf Unit = 100 9 16 17 (2) 17 14 12 6 6 4 3 2 2 16 000055555 17 0000055 18 0 19 00 20 000 21 00 22 000555 23 24 00 25 0 26 5 27 28 2 2 1 29 30 0 31 0 [3] n = 36 16 0 represents 16000 Figure 2 (a) Use Figure 2 to calculate the median, upper quartile and lower quartile of the data. Show all your working. (b) What other values, in addition to those that you have calculated in part (a), would you include in a five-figure summary? Give their values as part of your answer and give one advantage a five-figure summary has over a stem-and-leaf plot. (c) Calculate the range and the interquartile range for the data shown in Figure 2. Explain which you think is the more suitable measure of spread (d) Why do you think HESA publish median salaries and not mean salaries? (You might draw on evidence from the stemplot to support your answer.) [3] [3] [2] Question 4 (Unit 2) - 11 marks Do not use Minitab to answer this question. The Higher Education Statistics Authority (HESA) publishes the median salaries of full-time first degree leavers who were employed in the UK (www.hesa.ac.ukews/28-06-2018/sfr250-higher-education-leaver-statistics). The stemplot in Figure 2 was obtained from the data for 2016/17. Stem-and-Leaf Display: Salary = 36 Stem-and-leaf of Salary N Leaf Unit = 100 9 16 17 (2) 17 14 12 6 6 4 3 2 2 16 000055555 17 0000055 18 0 19 00 20 000 21 00 22 000555 23 24 00 25 0 26 5 27 28 2 2 1 29 30 0 31 0 [3] n = 36 16 0 represents 16000 Figure 2 (a) Use Figure 2 to calculate the median, upper quartile and lower quartile of the data. Show all your working. (b) What other values, in addition to those that you have calculated in part (a), would you include in a five-figure summary? Give their values as part of your answer and give one advantage a five-figure summary has over a stem-and-leaf plot. (c) Calculate the range and the interquartile range for the data shown in Figure 2. Explain which you think is the more suitable measure of spread (d) Why do you think HESA publish median salaries and not mean salaries? (You might draw on evidence from the stemplot to support your answer.) [3] [3] [2]

Step by Step Solution

There are 3 Steps involved in it

1 Expert Approved Answer
Step: 1 Unlock blur-text-image
Question Has Been Solved by an Expert!

Get step-by-step solutions from verified subject matter experts

Step: 2 Unlock
Step: 3 Unlock

Students Have Also Explored These Related General Management Questions!