

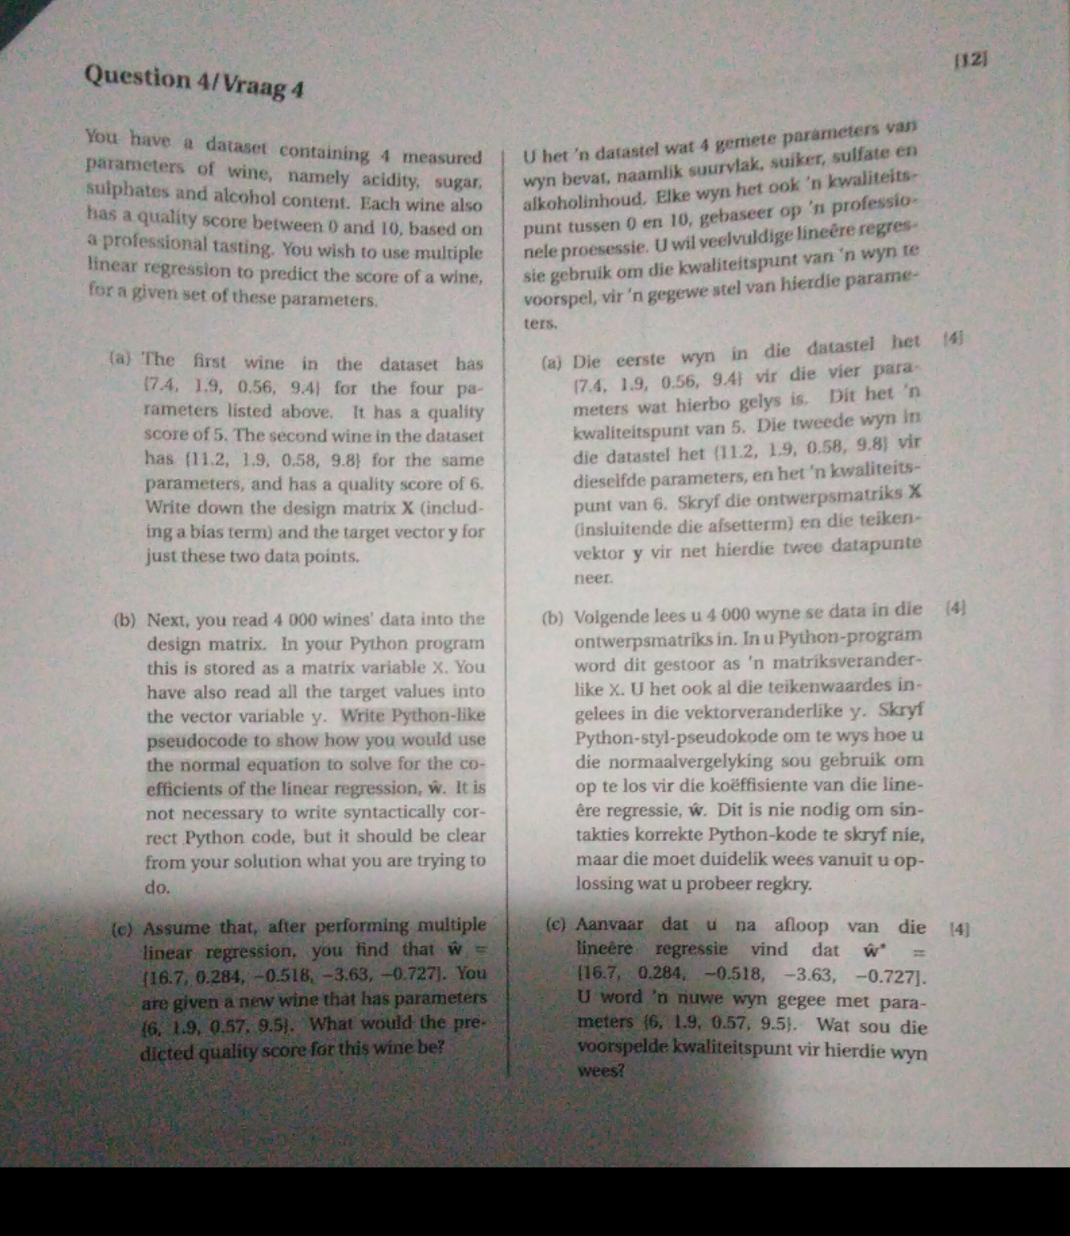
Question: Question 4 / Vraag 4 You have a dataset containing 4 measured parameters of wine, namely acidity, sugar, sulphates and alcohol content. Each wine also
Question Vraag
You have a dataset containing measured
parameters of wine, namely acidity, sugar,
sulphates and alcohol content. Each wine also
has a quality score between and based on
a professional tasting You wish to use muitiple
linear regression to predict the score of a wine,
for a given set of these parameters.
a The first wine in the dataset has
for the four pa
rameters listed above. It has a quality
score of The second wine in the dataset
has for the same
parameters, and has a quality score of
Write down the design matrix includ
ing a bias term and the target vector for
just these two data points.
b Next, you read wines' data into the
design matrix. In your Python program
this is stored as a matrix variable X You
have also read all the target values into
the vector variable Write Pythonlike
pseudocode to show how you would use
the normal equation to solve for the co
efficients of the linear regression, w It is
not necessary to write syntactically cor
rect Python code, but it should be clear
from your solution what you are trying to
do
c Assume that, after performing multiple
linear regression, you find that hat
You
are given a new wine that has parameters
What would the pre
dicted quality score for this wine be
U het n datastel wat gemete parameters vas
wyn beval, naamlik suurvlak, suiker, sulfate en
alkeholinhoud. Elke wyn het ook n kwaliteits
punt tussen en gebaseet op is professio
nele proesessie. U wil veelvuldige linere regres
sie gebrulk om die kwaliteitspunt van n wyn te
voorspel, vir n gegewe stel van hierdie parame
ters.
a Die cerste wyn in die datastel het
vir die vier para
meters wat hierbo gelys is Dit het
kwaliteitspunt van Die tweede wyn in
die datastel het vir
dieselfde parameters, en het kwaliteits
punt van Skryf die ontwerpsmatriks X
Instuitende die afsetterm en die teiken
vektor vir net hierdie twee datapunte
nees.
b Volgende lees wyne se data in die
ontwerpsmatriks in In u Pythonprogram
word dit gestoor as matriksverander
like U het ook al die teikenwaardes in
gelees in die vektorveranderlike Skryf
Pythonstylpseudokode om te wys hoe u
die normaalvergelyking sou gebruik om
op te los vir die koffisiente van die line
re regressie, hat Dit is nie nodig om sin
takties korrekte Pythonkode te skryf nie,
maar die moet duidelik wees vanuit op
lossing wat u probeer regkry.
c Aanvaar dat i na afloop van die
linere regressie vind dat hat
word n nuwe wyn gegee met para
meters Wat sou die
voorspelde kwaliteitspunt vir hierdie wyn
wees?
Step by Step Solution
There are 3 Steps involved in it
1 Expert Approved Answer
Step: 1 Unlock

Question Has Been Solved by an Expert!
Get step-by-step solutions from verified subject matter experts
Step: 2 Unlock
Step: 3 Unlock