

Question: Question 5 ( 1 5 pts ) : Dataset below presents historical daily call volume ( number of calls ) at a call center for
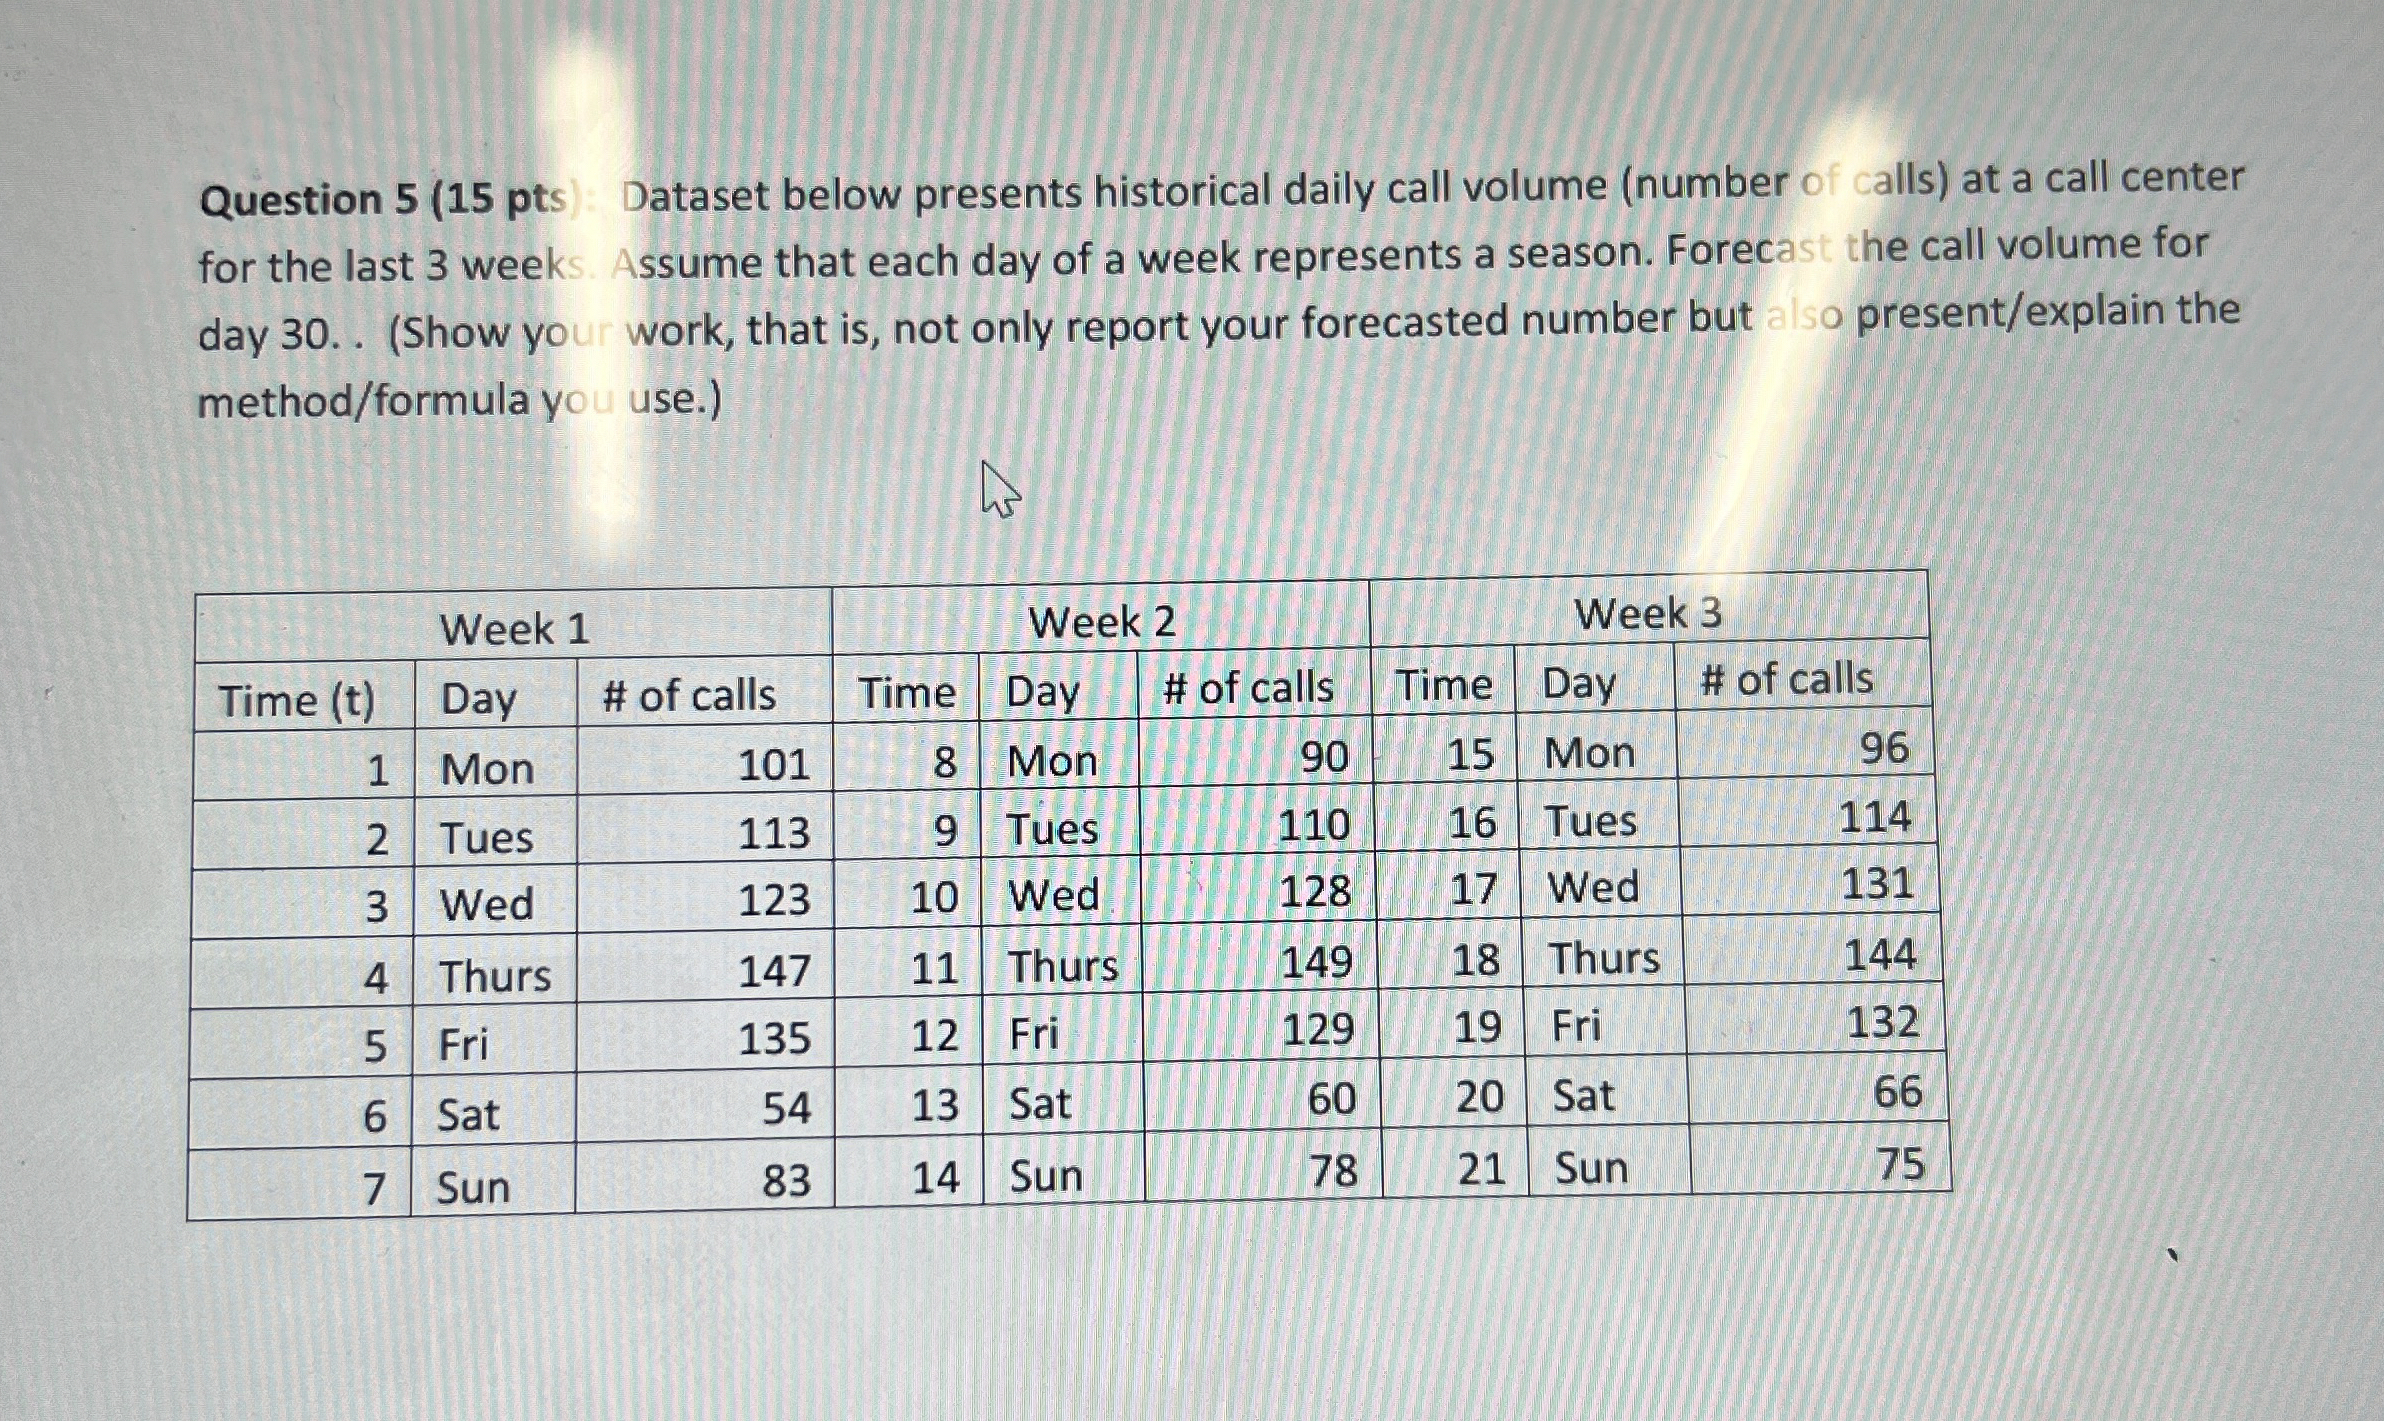
Question pts: Dataset below presents historical daily call volume number of calls at a call center for the last weeks. Assume that each day of a week represents a season. Forecast the call volume for day Show your work, that is not only report your forecasted number but also presentexplain the methodformula you use.
tableWeek Week Week Time tDay,# of calls,Time,Day,# of calls,Time,Day,# of callsMon,Mon,Mon,Tues,Tues,Tues,Wed,Wed,Wed,Thurs,Thurs,Thurs,Fri,Fri,Fri,Sat,Sat,Sat,Sun,Sun,Sun,
Step by Step Solution
There are 3 Steps involved in it
1 Expert Approved Answer
Step: 1 Unlock

Question Has Been Solved by an Expert!
Get step-by-step solutions from verified subject matter experts
Step: 2 Unlock
Step: 3 Unlock