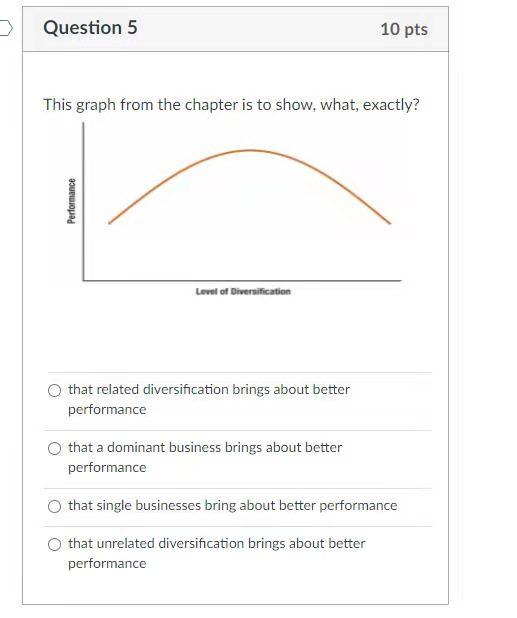
Question: Question 5 10 pts This graph from the chapter is to show, what, exactly? Performance Lovel of Diversification that related diversification brings about better performance

Question 5 10 pts This graph from the chapter isQuestion 5 10 pts This graph from the chapter isQuestion 5 10 pts This graph from the chapter isQuestion 5 10 pts This graph from the chapter isQuestion 5 10 pts This graph from the chapter isQuestion 5 10 pts This graph from the chapter is

Question 5 10 pts This graph from the chapter is to show, what, exactly? Performance Lovel of Diversification that related diversification brings about better performance O that a dominant business brings about better performance that single businesses bring about better performance that unrelated diversification brings about better performance D Question 6 10 pts Which are the 3 corporate strategy diversification dimensions? Horizontal/Product Diversification Vertical Integration Economic/Enterprise Value Geographic Scope Accounting Profitability Shareholder Value Sustainable Competitive Advantage Question 7 10 pts What does this graphic in the book describe? wowe Cell TV Na MPS C VOR Airplane All of these The accelerated rate of new tech product change over the years The life-cycle of most products. Types of innovation Idea, Invention, Innovation, Imitation Question 8 10 pts Business strategy addresses "HOW to compete." Corporate strategy addresses"_(?)__ to compete." O All of these O HOW WHEN O WHERE O IF None of these Question 9 10 pts Which of the 3 diversification dimensions does this information about Zara apply best to? YES: design NO: materials/fabric production YES: cutting NO: assembly (though they do have close relationships with assemblers) YES: quality control and packing for distribution NO: distribution YES: stores Geographic Scope Vertical Integration Horizontal/Product Diversification Sustainable Competitive Advantage Economic/Enterprise Value Shareholder Value Question 10 10 pts According to the book, what was the primary point behind this graph? Technology Early Enthusiasts Adopters 28% 13.5 Early Majority 34% Late Majority 34% Laggards 10% The key to any product launch is to get the technology enthusiasts first This is the typical life-cycle of most products There is a "chasm" you need to cross to be successful It takes many years for most products to be successful

Step by Step Solution

There are 3 Steps involved in it

1 Expert Approved Answer
Step: 1 Unlock blur-text-image
Question Has Been Solved by an Expert!

Get step-by-step solutions from verified subject matter experts

Step: 2 Unlock
Step: 3 Unlock

Students Have Also Explored These Related General Management Questions!