

Question: Question 5 2 pt The dotplot shows how many times a computer was used daily at a public library during a 30-day period. ..... ..
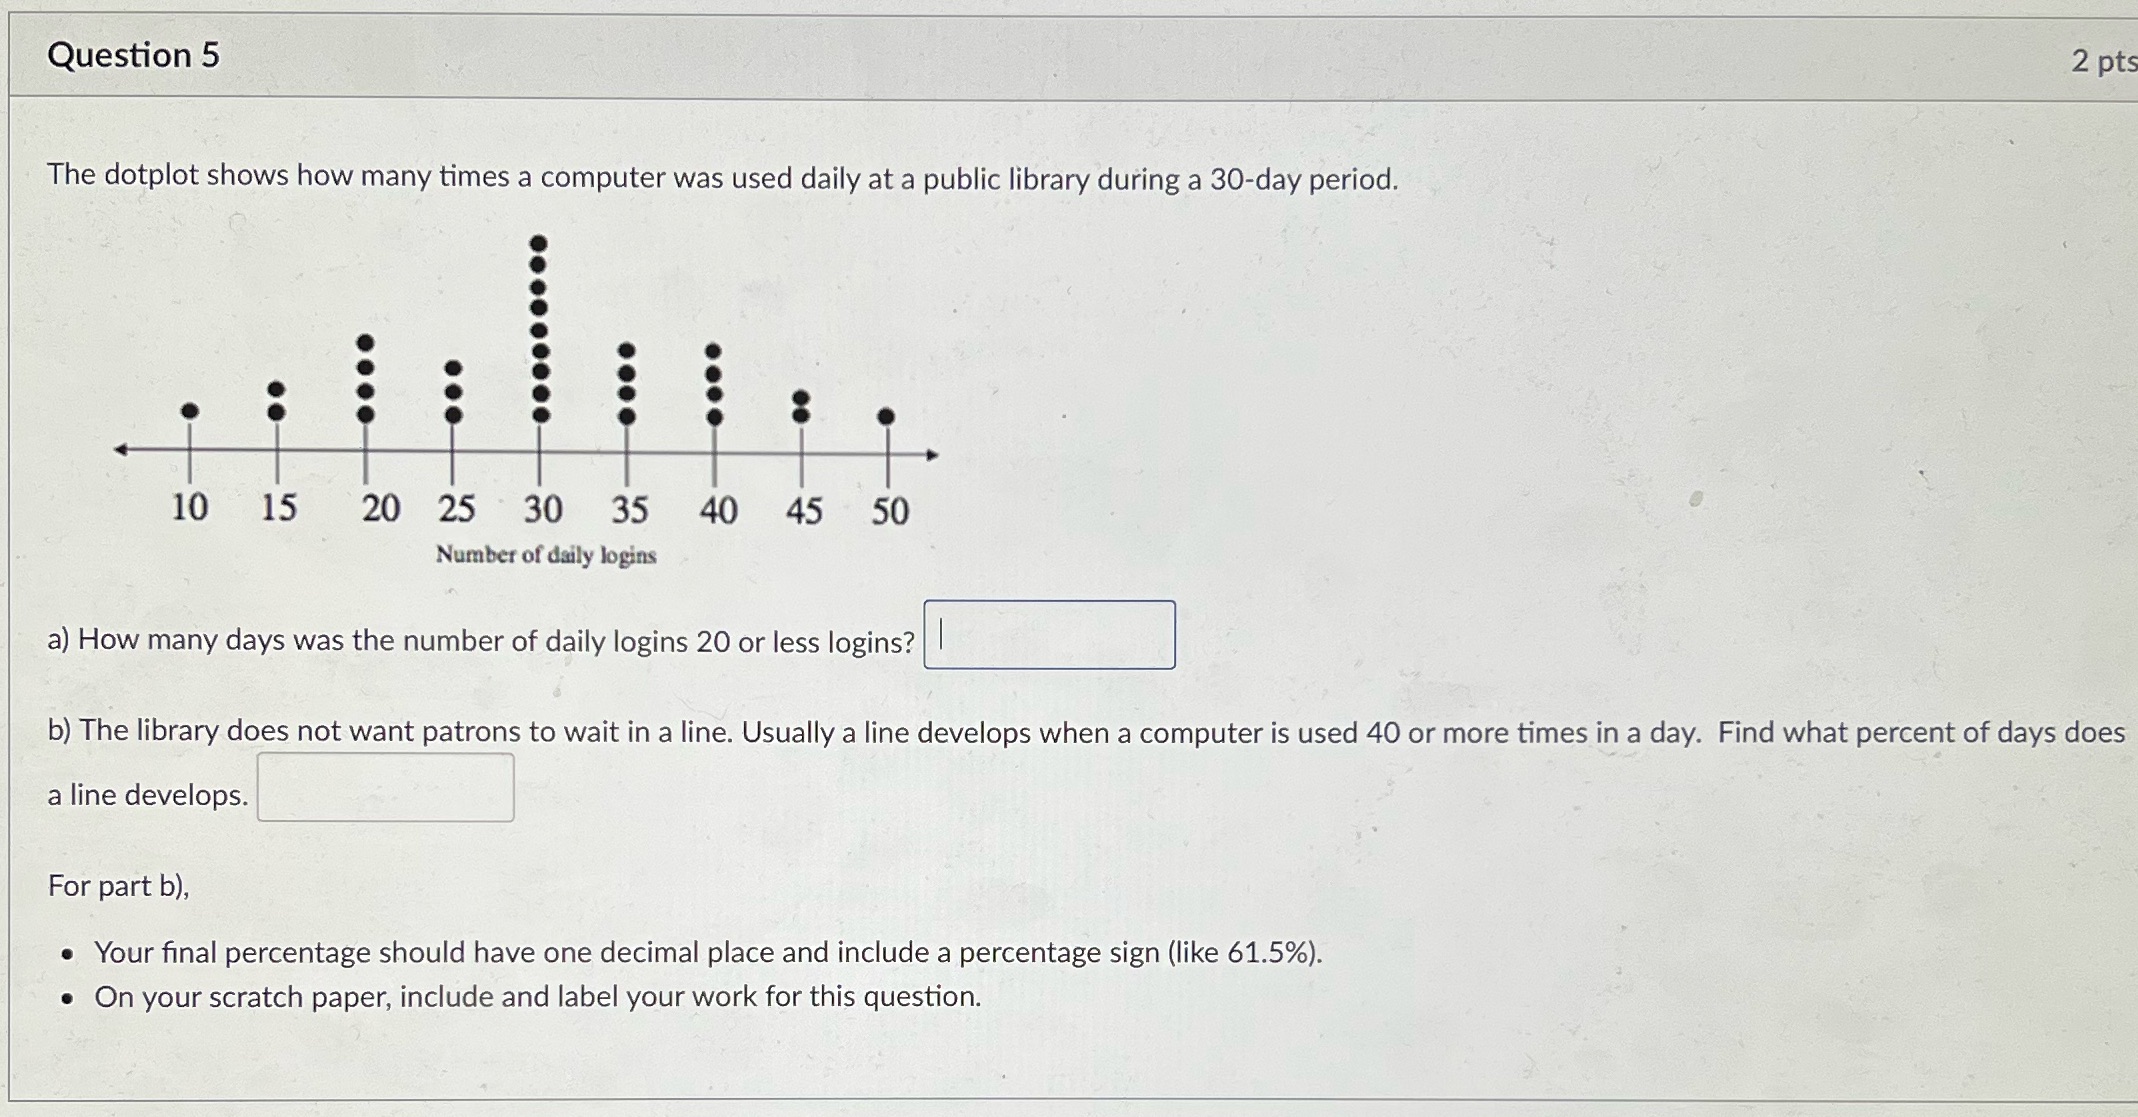
Question 5 2 pt The dotplot shows how many times a computer was used daily at a public library during a 30-day period. ..... .. 10 15 20 25 30 35 40 45 50 Number of daily logins a) How many days was the number of daily logins 20 or less logins? b) The library does not want patrons to wait in a line. Usually a line develops when a computer is used 40 or more times in a day. Find what percent of days does a line develops. For part b), . Your final percentage should have one decimal place and include a percentage sign (like 61.5%). . On your scratch paper, include and label your work for this
Step by Step Solution
There are 3 Steps involved in it
1 Expert Approved Answer
Step: 1 Unlock

Question Has Been Solved by an Expert!
Get step-by-step solutions from verified subject matter experts
Step: 2 Unlock
Step: 3 Unlock