

Question: Question 5 (40 points): IIR Filter Design Using the Filter Design and Analysis Tool You can start this GUI-based application by typing fdatool at the
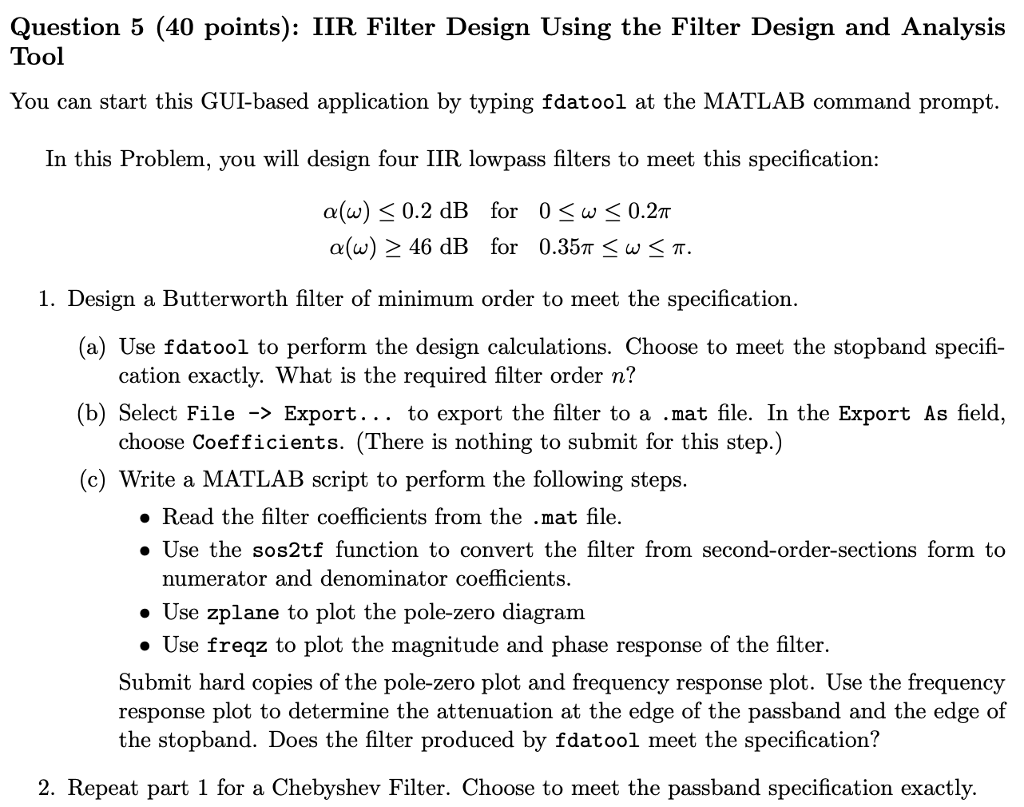
Question 5 (40 points): IIR Filter Design Using the Filter Design and Analysis Tool You can start this GUI-based application by typing fdatool at the MATLAB command prompt. In this Problem, you will design four IIR lowpass filters to meet this specification: a(u) 0.2 dB for 0-w-02n a(u)> 46 dB for 0.35m-w-T. 1. Design a Butterworth filter of minimum order to meet the specification. (a) Use fdatool to perform the design calculations. Choose to meet the stopband specifi- cation exactly. What is the required filter order n? (b) Select File -> Export... to export the filter to a .mat file. In the Export As field, choose Coefficients. (There is nothing to submit for this step.) (c) Write a MATLAB script to perform the following steps. Read the filter coefficients from the .mat file. Use the sos2tf function to convert the filter from second-order-sections form to numerator and denominator coefficients * Use zplane to plot the pole-zero diagranm Use freqz to plot the magnitude and phase response of the filter. Submit hard copies of the pole-zero plot and frequency response plot. Use the frequencv response plot to determine the attenuation at the edge of the passband and the edge of the stopband. Does the filter produced by fdatool meet the specification? 2. Repeat part 1 for a Chebyshev Filter. Choose to meet the passband specification exactly. Question 5 (40 points): IIR Filter Design Using the Filter Design and Analysis Tool You can start this GUI-based application by typing fdatool at the MATLAB command prompt. In this Problem, you will design four IIR lowpass filters to meet this specification: a(u) 0.2 dB for 0-w-02n a(u)> 46 dB for 0.35m-w-T. 1. Design a Butterworth filter of minimum order to meet the specification. (a) Use fdatool to perform the design calculations. Choose to meet the stopband specifi- cation exactly. What is the required filter order n? (b) Select File -> Export... to export the filter to a .mat file. In the Export As field, choose Coefficients. (There is nothing to submit for this step.) (c) Write a MATLAB script to perform the following steps. Read the filter coefficients from the .mat file. Use the sos2tf function to convert the filter from second-order-sections form to numerator and denominator coefficients * Use zplane to plot the pole-zero diagranm Use freqz to plot the magnitude and phase response of the filter. Submit hard copies of the pole-zero plot and frequency response plot. Use the frequencv response plot to determine the attenuation at the edge of the passband and the edge of the stopband. Does the filter produced by fdatool meet the specification? 2. Repeat part 1 for a Chebyshev Filter. Choose to meet the passband specification exactly
Step by Step Solution
There are 3 Steps involved in it

Get step-by-step solutions from verified subject matter experts