

Question: Question 5 : Analyze the QSAR fish toxicity data set from the site: https: / / archive . ics.uci.edu / ml / datasets / QSAR
Question : Analyze the QSAR fish toxicity data set from the site:
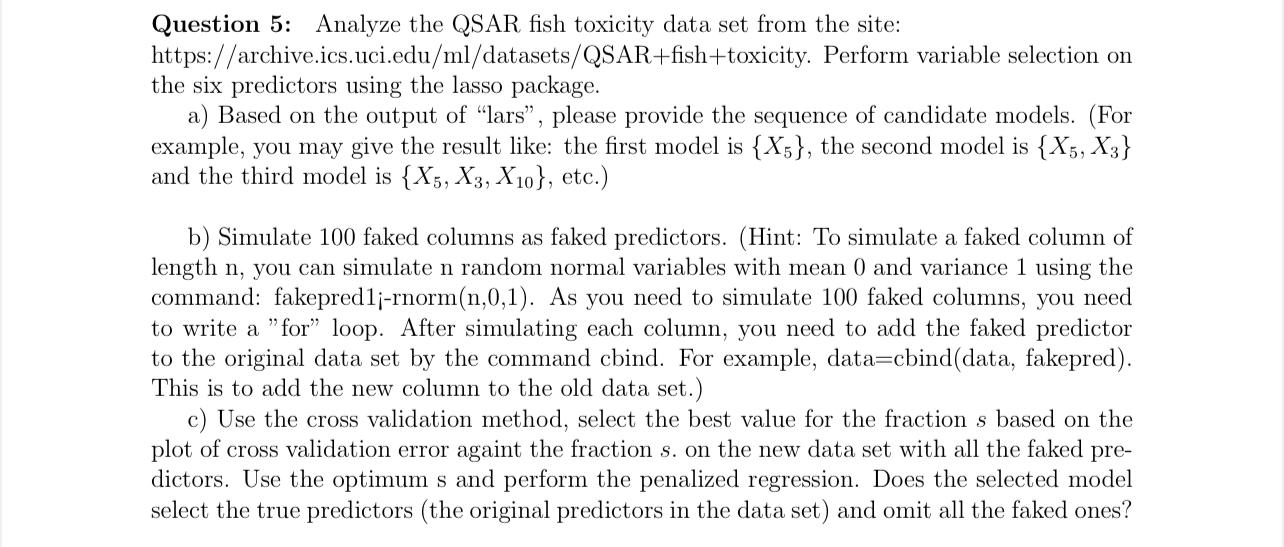
https:archiveics.uci.edumldatasetsQSARfishtoxicity. Perform variable selection on the six predictors using the lasso package.
a Based on the output of "lars", please provide the sequence of candidate models. For example, you may give the result like: the first model is the second model is and the third model is etc.
b Simulate faked columns as faked predictors. Hint: To simulate a faked column of length you can simulate random normal variables with mean and variance using the command: fakepredirnormn As you need to simulate faked columns, you need to write a "for" loop. After simulating each column, you need to add the faked predictor to the original data set by the command cbind. For example, datacbinddata fakepred This is to add the new column to the old data set.
c Use the cross validation method, select the best value for the fraction based on the plot of cross validation error againt the fraction on the new data set with all the faked predictors. Use the optimum s and perform the penalized regression. Does the selected model select the true predictors the original predictors in the data set and omit all the faked ones?
Write in R code pls
Step by Step Solution
There are 3 Steps involved in it
1 Expert Approved Answer
Step: 1 Unlock

Question Has Been Solved by an Expert!
Get step-by-step solutions from verified subject matter experts
Step: 2 Unlock
Step: 3 Unlock