

Question: Question 5 : Consider the market for wheat represented in the diagram below. Initially, the equilibrium price for wheat is $1 per pound, and the
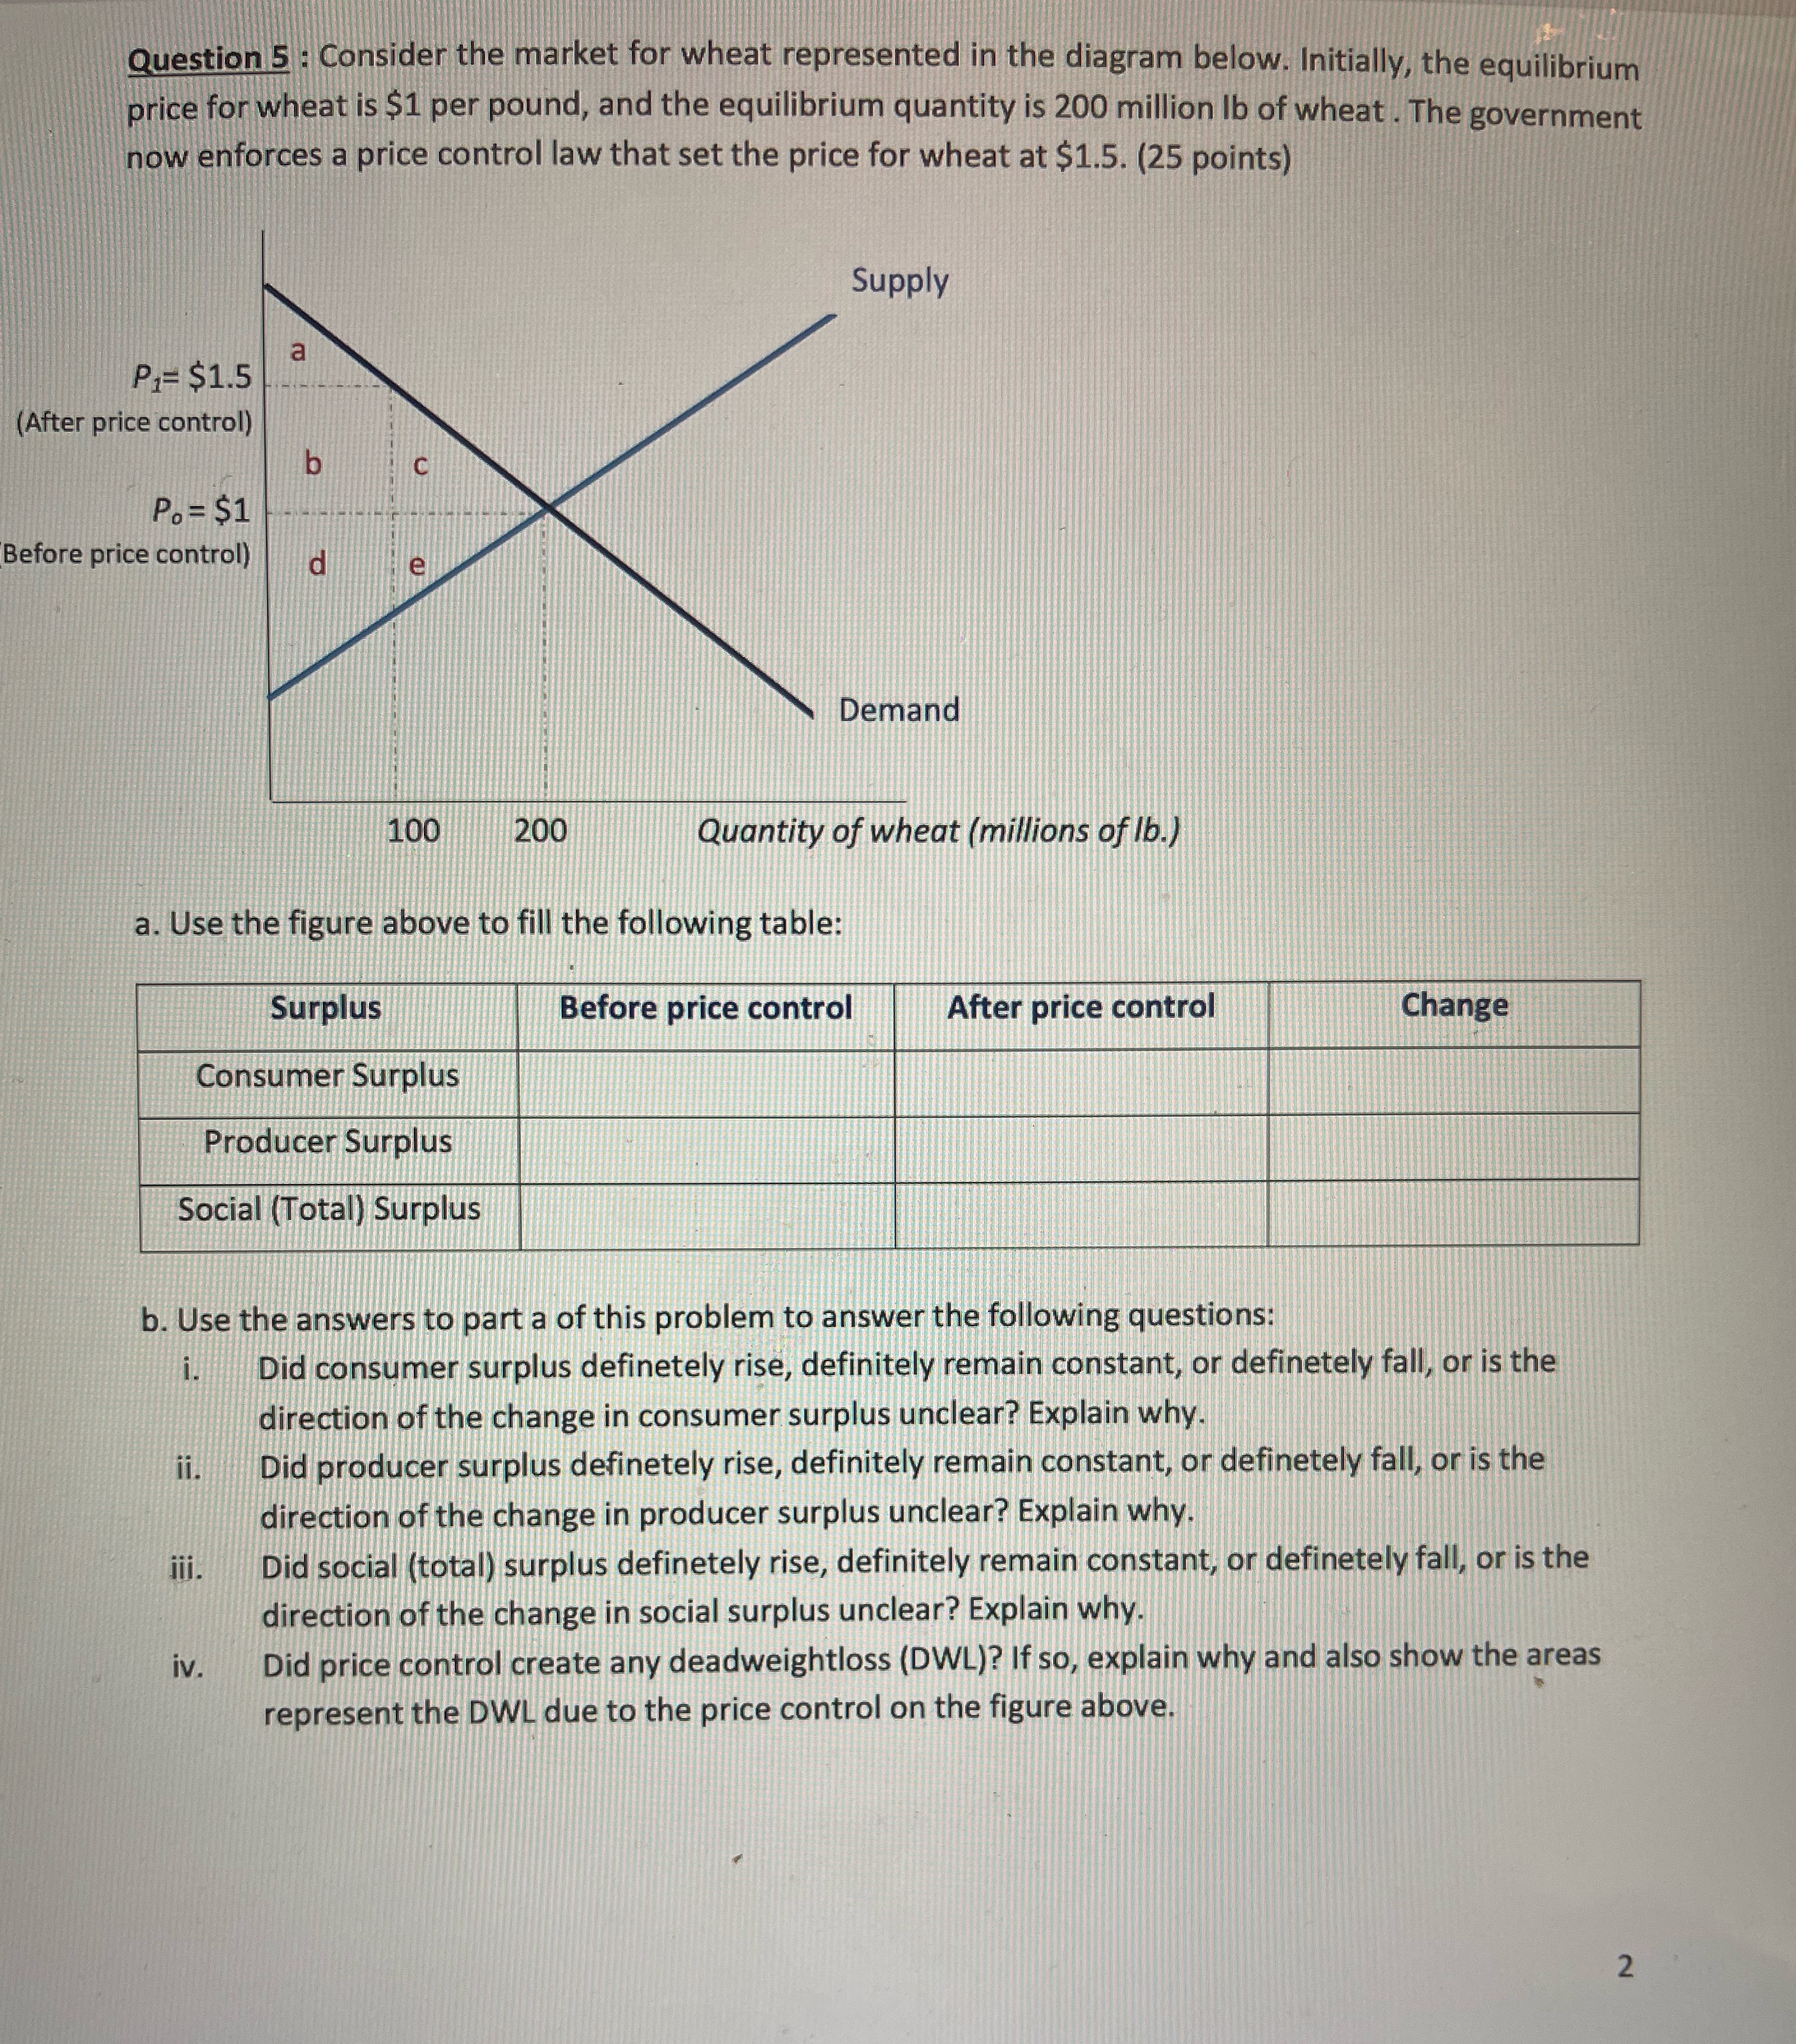

Question 5 : Consider the market for wheat represented in the diagram below. Initially, the equilibrium price for wheat is $1 per pound, and the equilibrium quantity is 200 million lb of wheat . The government now enforces a price control law that set the price for wheat at $1.5. (25 points) Supply a P1= $1.5 (After price control) b C Po = $1 Before price control d e Demand 100 200 Quantity of wheat (millions of lb.) a. Use the figure above to fill the following table: Surplus Before price control After price control Change Consumer Surplus Producer Surplus Social (Total) Surplus b. Use the answers to part a of this problem to answer the following questions: i. Did consumer surplus definetely rise, definitely remain constant, or definetely fall, or is the direction of the change in consumer surplus unclear? Explain why. ii. Did producer surplus definetely rise, definitely remain constant, or definetely fall, or is the direction of the change in producer surplus unclear? Explain why. iii. Did social (total) surplus definetely rise, definitely remain constant, or definetely fall, or is the direction of the change in social surplus unclear? Explain why. iv . Did price control create any deadweightloss (DWL)? If so, explain why and also show the areas represent the DWL due to the price control on the figure above. 2
Step by Step Solution
There are 3 Steps involved in it

Get step-by-step solutions from verified subject matter experts