Question: Question 5 Do the two systems have the same financial risk? (Put another way, are the cash flows being discounted equally risky?) If not, why
Question 5
Do the two systems have the same financial risk? (Put another way, are the cash flows being discounted equally risky?) If not, why not? Modify your analysis to incorporate differential risk if you believe that it exists.
Question 2
Consider the base case situation for the first system to be acquired.
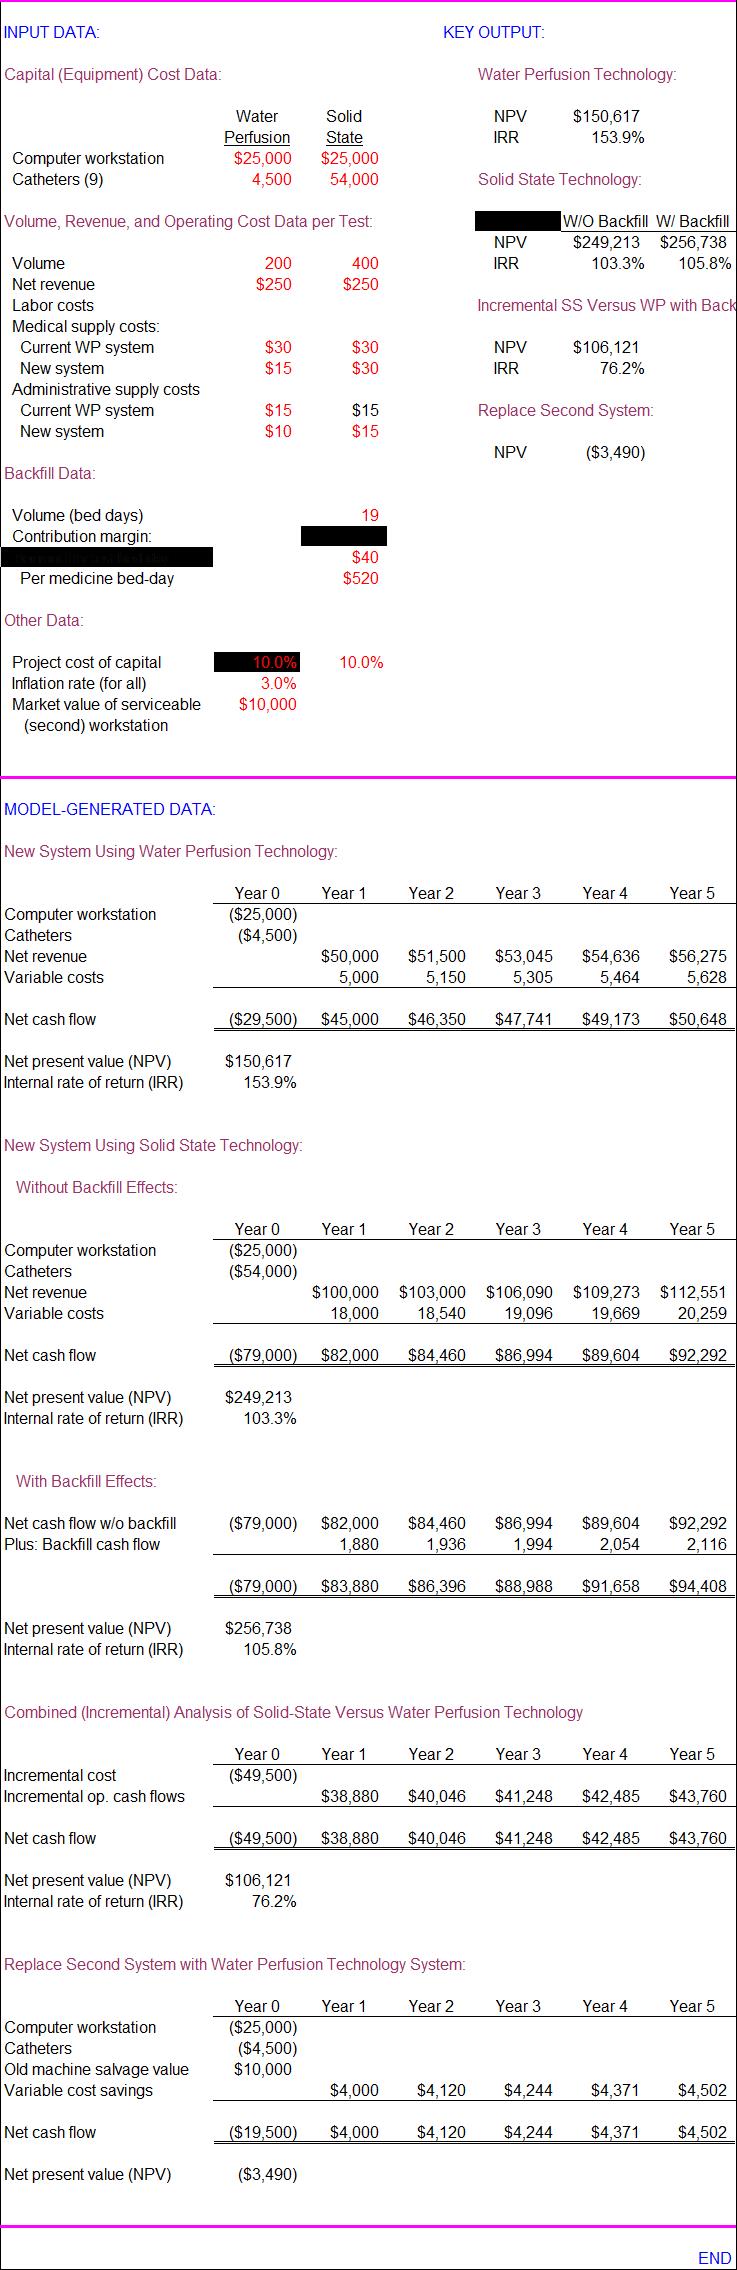
a. What are the NPVs and IRRs of the two alternative technologies? What factor drives the financial superiority of the more profitable technology?
b. What is the incremental NPV of solid state versus water perfusion technology? What does the incremental NPV tell us?
Question 7
Consider the second proposed (water perfusion) system acquisition.
a. Should this system be purchased?
b. Explain why and how this analysis differs from the one conducted in Question 2.
INPUT DATA: KEY OUTPUT: Capital (Equipment) Cost Data: Water Perfusion Technology: Water Solid NPV $150,617 Perfusion State IRR 153.9% Computer workstation $25,000 $25,000 Catheters (9) 4,500 54,000 Solid State Technology: Volume, Revenue, and Operating Cost Data per Test W/O Backfill W/ Backfill NPV $249,213 $256,738 Volume 200 400 IRR 103.3% 105.8% Net revenue $250 $250 Labor costs Incremental SS Versus WP with Back Medical supply costs: Current WP system $30 $30 NPV $106,121 New system $15 $30 IRR 76.2% Administrative supply costs Current WP system $15 $15 Replace Second System: New system $10 $15 NPV ($3,490) Backfill Data: Volume (bed days) 19 Contribution margin: $40 Per medicine bed-day $520 Other Data Project cost of capital 10.0% 10.0% Inflation rate (for all) 3.0% Market value of serviceable $10,000 (second) workstation MODEL-GENERATED DATA: New System Using Water Perfusion Technology: Year 0 Year 1 Year 2 Year 3 Year 4 Year 5 Computer workstation ($25,000) Catheters ($4,500) Net revenue $50,000 $51,500 $53,045 $54,636 $56,275 Variable costs 5.000 5.150 5 305 5.46 5,628 Net cash flow ($29,500) $45,000 $46,350 $47,741 $49,173 $50,648 Net present value (NPV) $150,617 Internal rate of return (IRR) 153.9% New System Using Solid State Technology: Without Backfill Effects: Year 0 Year 1 Year 2 Year 3 Year 4 Year 5 Computer workstation ($25,000) Catheters $54,000) Net revenue $100,000 $103,000 $106,090 $109,273 $112,551 Variable costs 18.000 18.540 19 096 19.669 20.259 Net cash flow ($79,000) $82,000 $84,460 $86,994 $89,604 $92,292 Net present value (NPV) $249,213 Internal rate of return (IRR) 103.3% With Backfill Effects: flow w/o backfill ($79,000) $82,000 $84,460 $86,994 $89,604 $92,292 Plus: Backfill cash flow 1.880 1.936 1,994 2.054 2,116 ($79,000) $83,880 $86,396 $88.988 $91.658 $94,408 Net present value (NPV) $256,738 Internal rate of return (IRR) 105.8% Combined (Incremental) Analysis of Solid-State Versus Water Perfusion Technology Year 0 Year 1 Year 2 Year 3 Year 4 Year 5 Incremental cost ($49,500) Incremental op. cash flows $38,880 $40,046 $41,248 $42,485 $43,760 Net cash flow ($49,500) $38,880 $40,046 $41,248 $42,485 $43,760 Net present value (NPV) $106, 121 Internal rate of return (IRR) 76.2% Replace Second System with Water Perfusion Technology System: Year 0 Year 1 Year 2 Year 3 Year 4 Year 5 Computer workstation ($25,000) Catheters ($4,500) Old machine salvage value $10,000 Variable cost savings $4.000 $4, 120 $4,244 $4,371 $4,502 Net cash flow ($19,500) $4,000 $4, 120 $4,244 $4,371 $4,502 Net present value (NPV) ($3,490) END