

Question: Question 5: (from chapter 4) The rst table below shows the probability of people in a town being Coservative, Socialist or Libreal. The second table
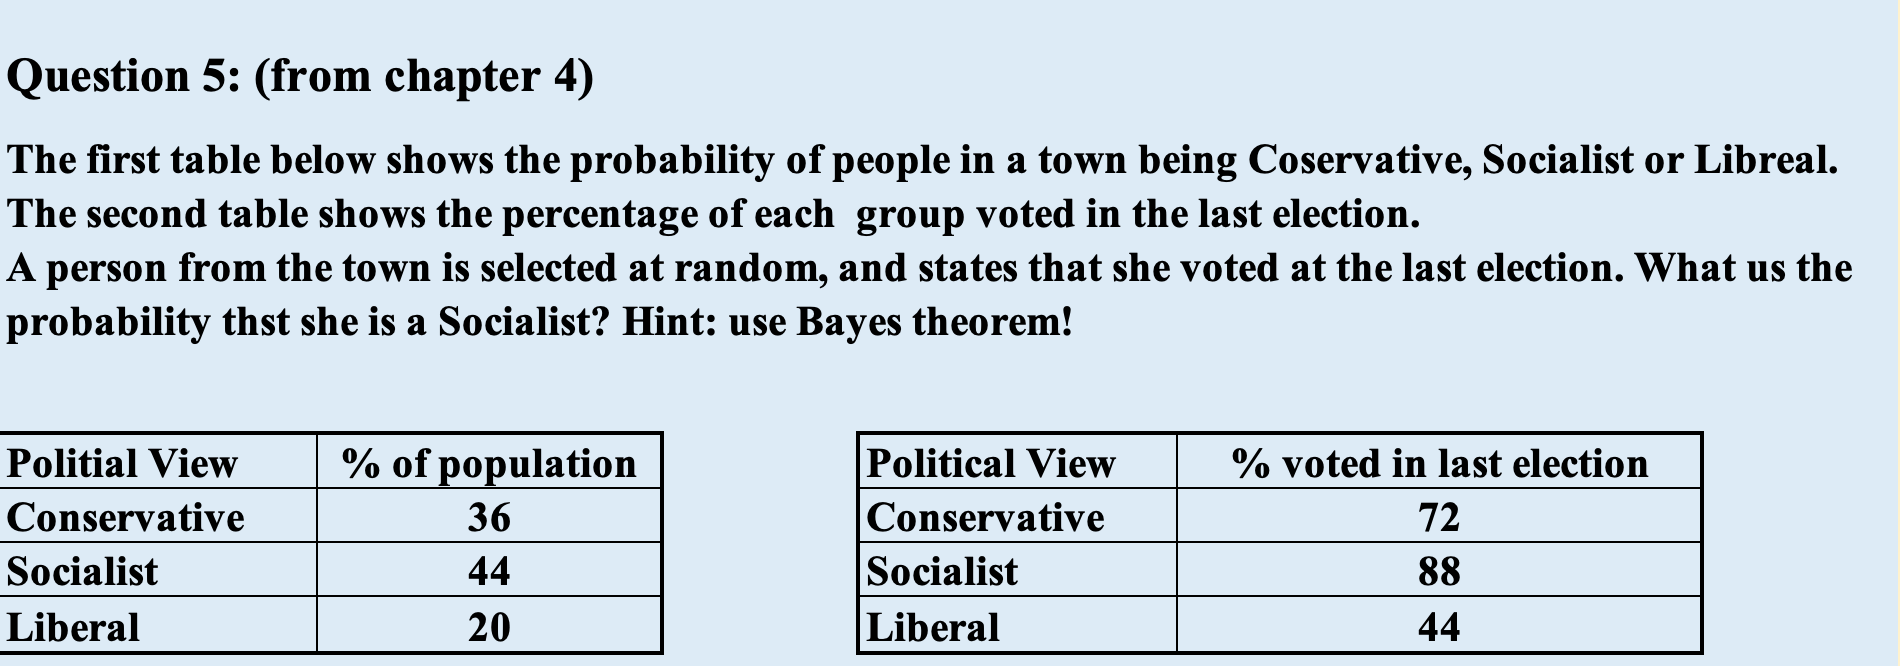
Question 5: (from chapter 4) The rst table below shows the probability of people in a town being Coservative, Socialist or Libreal. The second table shows the percentage of each group voted in the last election. A person from the town is selected at random, and states that she voted at the last election. What us the probability thst she is a Socialist? Hint: use Bayes theorem! Politial View % of population Political View % voted in last election Conservative .5- Socialist Socialist 88 Liberal Liberal 44
Step by Step Solution
There are 3 Steps involved in it
1 Expert Approved Answer
Step: 1 Unlock

Question Has Been Solved by an Expert!
Get step-by-step solutions from verified subject matter experts
Step: 2 Unlock
Step: 3 Unlock