

Question: Question 5 Ft Ira 0 On Owl Quantity 0 O.' O. Gummy Use the graphs above the answer the question (the letter for that graph

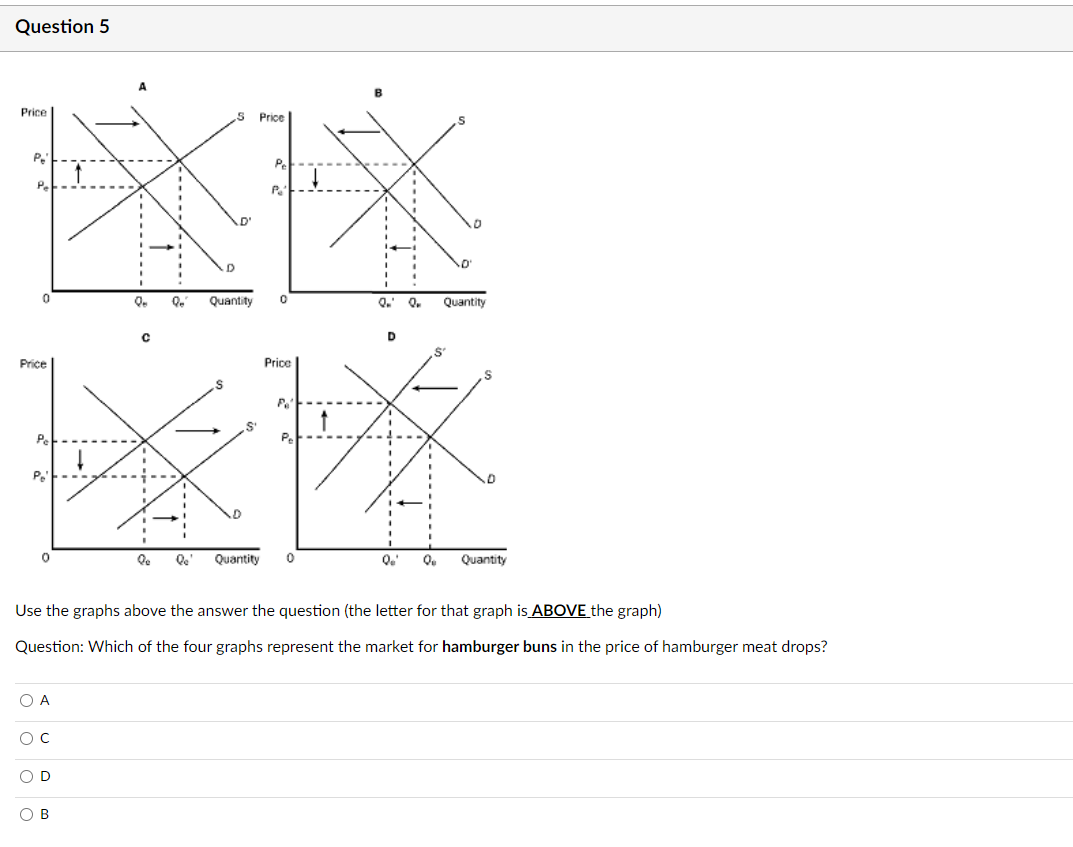
Question 5 Ft Ira 0 On Owl Quantity 0 O.' O. Gummy Use the graphs above the answer the question (the letter for that graph is ABOVE the graph) Question: Which of the four graphs represent the market for hamburger buns in the price of hamburger meat drops? OA OC OD OB
Step by Step Solution
There are 3 Steps involved in it
1 Expert Approved Answer
Step: 1 Unlock

Question Has Been Solved by an Expert!
Get step-by-step solutions from verified subject matter experts
Step: 2 Unlock
Step: 3 Unlock