

Question: Question 5 Part I Theoretical Discussion (5096) a) State steps in hypotheses testing b) Explain two-tailed and one-tailed tests c) State multiple regression assumptions in
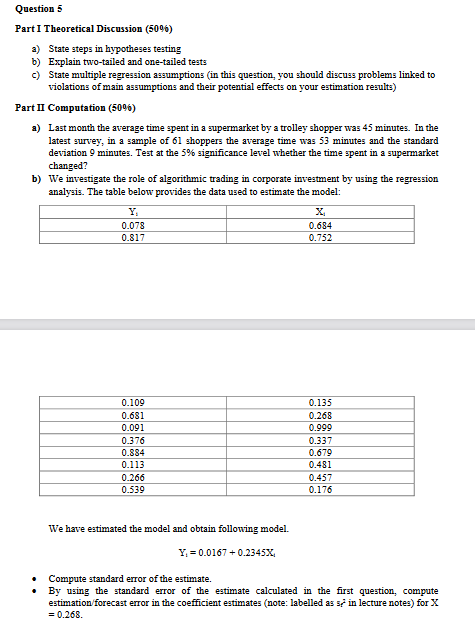
Question 5 Part I Theoretical Discussion (5096) a) State steps in hypotheses testing b) Explain two-tailed and one-tailed tests c) State multiple regression assumptions in this question, you should discuss problems linked to violations of main assumptions and their potential effects on your estimation results) Part II Computation (50%) a) Last month the average time spent in a supermarket by a trolley shopper was 45 minutes. In the latest survey, in a sample of 61 shoppers the average time was 53 minutes and the standard deviation 9 minutes. Test at the 5% significance level whether the time spent in a supermarket changed? b) We investigate the role of algorithmic trading in corporate investment by using the regression analysis. The table below provides the data used to estimate the model: Y 0.078 0.817 0.684 0.752 0.109 0.681 0.091 0.376 0.884 0.113 0.266 0.539 0.135 0.268 0.999 0.337 0.679 0.481 0.457 0.176 We have estimated the model and obtain following model. Y = 0.0167 + 0.2345X Compute standard error of the estimate. By using the standard error of the estimate calculated in the first question, compute estimation forecast error in the coefficient estimates (note: labelled as sin lecture notes) for X = 0.268. Question 5 Part I Theoretical Discussion (5096) a) State steps in hypotheses testing b) Explain two-tailed and one-tailed tests c) State multiple regression assumptions in this question, you should discuss problems linked to violations of main assumptions and their potential effects on your estimation results) Part II Computation (50%) a) Last month the average time spent in a supermarket by a trolley shopper was 45 minutes. In the latest survey, in a sample of 61 shoppers the average time was 53 minutes and the standard deviation 9 minutes. Test at the 5% significance level whether the time spent in a supermarket changed? b) We investigate the role of algorithmic trading in corporate investment by using the regression analysis. The table below provides the data used to estimate the model: Y 0.078 0.817 0.684 0.752 0.109 0.681 0.091 0.376 0.884 0.113 0.266 0.539 0.135 0.268 0.999 0.337 0.679 0.481 0.457 0.176 We have estimated the model and obtain following model. Y = 0.0167 + 0.2345X Compute standard error of the estimate. By using the standard error of the estimate calculated in the first question, compute estimation forecast error in the coefficient estimates (note: labelled as sin lecture notes) for X = 0.268
Step by Step Solution
There are 3 Steps involved in it

Get step-by-step solutions from verified subject matter experts