

Question: QUESTION 5 The following graph shows a scatter plot and the line of best fit between student/faculty ratio and alumni giving rate for 48 private
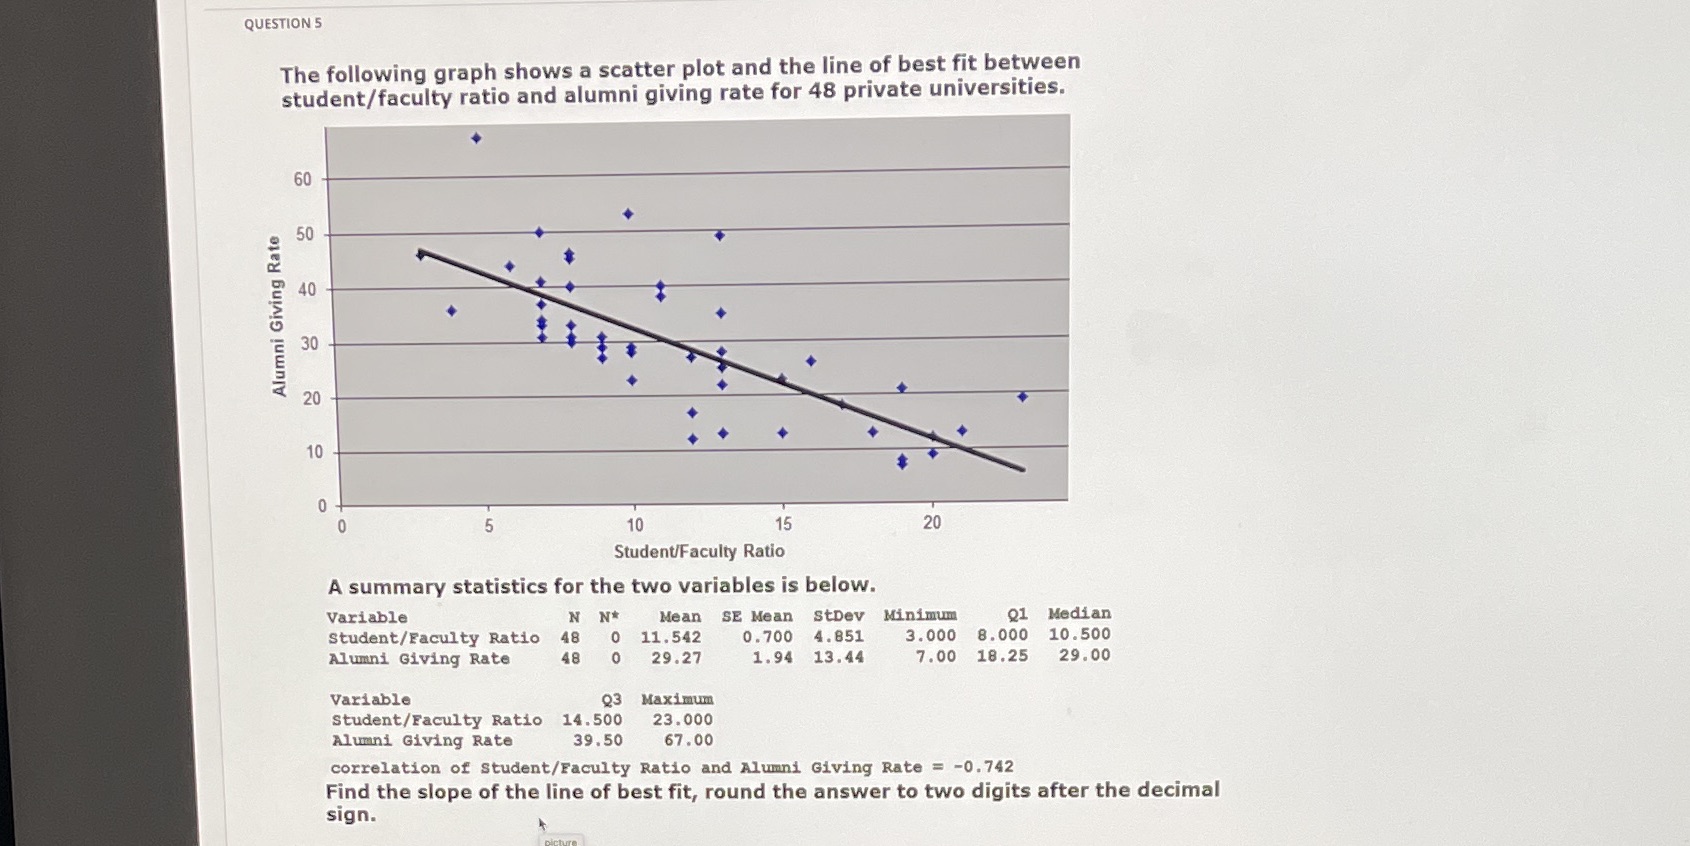

QUESTION 5 The following graph shows a scatter plot and the line of best fit between student/faculty ratio and alumni giving rate for 48 private universities. 60 50 40 Alumni Giving Rate 30 20 10 10 15 20 Student/Faculty Ratio A summary statistics for the two variables is below. Variable N N* Mean SE Mean StDev Minimum Q1 Median Student/Faculty Ratio 48 0 11. 542 0. 700 4. 851 3.000 8.000 10.500 Alumni Giving Rate 48 0 29.27 1.94 13.44 7.00 18.25 29.00 Variable Q3 Maximum Student/Faculty Ratio 14.500 23.000 Alumni Giving Rate 39.50 67.00 correlation of Student/Faculty Ratio and Alumni Giving Rate = -0.742 Find the slope of the line of best fit, round the answer to two digits after the decimal sign
Step by Step Solution
There are 3 Steps involved in it

Get step-by-step solutions from verified subject matter experts