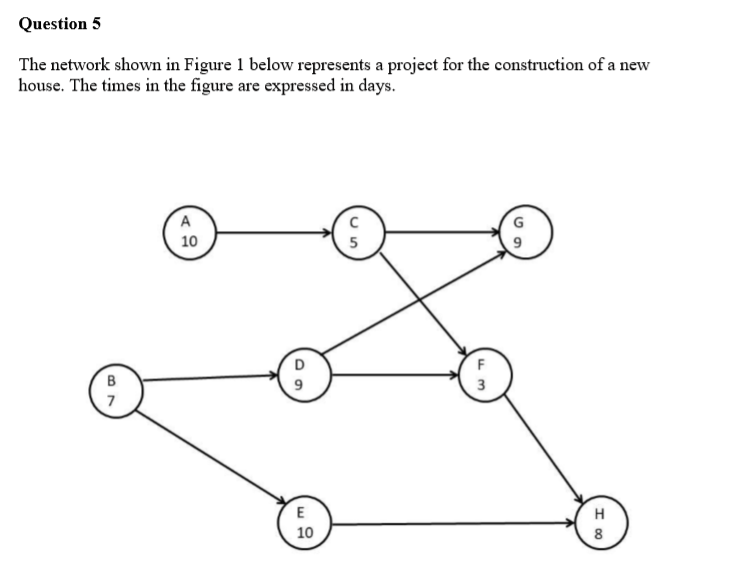
Question: Question 5 The network shown in Figure 1 below represents a project for the construction of a new house. The times in the figure are

Question 5 The network shown in Figure 1 below

Question 5 The network shown in Figure 1 below

Question 5 The network shown in Figure 1 below represents a project for the construction of a new house. The times in the figure are expressed in days. 10 5 D B 7 F 3 E E 10 I 00 (v) How long can activity A be delayed without delaying the minimum completion time of the project? [2 marks] (vi) How long will the project be delayed if activity A is delayed by 7 days? How long will the project be delayed if activity D is delayed by 3 days? [2 marks]

Step by Step Solution

There are 3 Steps involved in it

1 Expert Approved Answer
Step: 1 Unlock blur-text-image
Question Has Been Solved by an Expert!

Get step-by-step solutions from verified subject matter experts

Step: 2 Unlock
Step: 3 Unlock

Students Have Also Explored These Related General Management Questions!