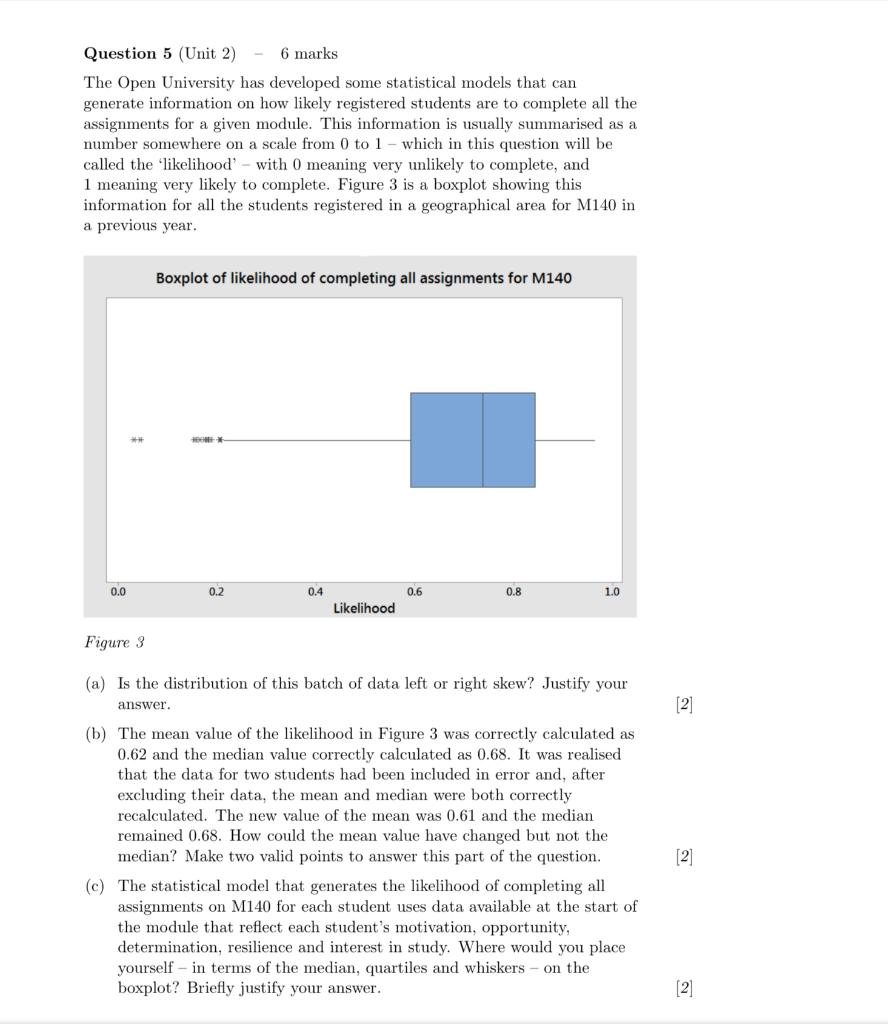
Question: Question 5 (Unit 2) 6 marks The Open University has developed some statistical models that can generate information on how likely registered students are to

Question 5 (Unit 2) 6 marks The Open University

Question 5 (Unit 2) 6 marks The Open University has developed some statistical models that can generate information on how likely registered students are to complete all the assignments for a given module. This information is usually summarised as a number somewhere on a scale from 0 to 1 - which in this question will be called the likelihood' - with O meaning very unlikely to complete, and 1 meaning very likely to complete. Figure 3 is a boxplot showing this information for all the students registered in a geographical area for M140 in a previous year. Boxplot of likelihood of completing all assignments for M140 ** 0.0 0.2 0.4 0.6 0.8 1.0 Likelihood Figure 3 (a) Is the distribution of this batch of data left or right skew? Justify your answer. [2] (b) The mean value of the likelihood in Figure 3 was correctly calculated as 0.62 and the median value correctly calculated as 0.68. It was realised that the data for two students had been included in error and, after excluding their data, the mean and median were both correctly recalculated. The new value of the mean was 0.61 and the median remained 0.68. How could the mean value have changed but not the median? Make two valid points to answer this part of the question. (c) The statistical model that generates the likelihood of completing all assignments on M140 for each student uses data available at the start of the module that reflect each student's motivation, opportunity, determination, resilience and interest in study. Where would you place yourself - in terms of the median, quartiles and whiskers on the boxplot? Briefly justify your answer. [2] [2] Question 5 (Unit 2) 6 marks The Open University has developed some statistical models that can generate information on how likely registered students are to complete all the assignments for a given module. This information is usually summarised as a number somewhere on a scale from 0 to 1 - which in this question will be called the likelihood' - with O meaning very unlikely to complete, and 1 meaning very likely to complete. Figure 3 is a boxplot showing this information for all the students registered in a geographical area for M140 in a previous year. Boxplot of likelihood of completing all assignments for M140 ** 0.0 0.2 0.4 0.6 0.8 1.0 Likelihood Figure 3 (a) Is the distribution of this batch of data left or right skew? Justify your answer. [2] (b) The mean value of the likelihood in Figure 3 was correctly calculated as 0.62 and the median value correctly calculated as 0.68. It was realised that the data for two students had been included in error and, after excluding their data, the mean and median were both correctly recalculated. The new value of the mean was 0.61 and the median remained 0.68. How could the mean value have changed but not the median? Make two valid points to answer this part of the question. (c) The statistical model that generates the likelihood of completing all assignments on M140 for each student uses data available at the start of the module that reflect each student's motivation, opportunity, determination, resilience and interest in study. Where would you place yourself - in terms of the median, quartiles and whiskers on the boxplot? Briefly justify your answer. [2] [2]

Step by Step Solution

There are 3 Steps involved in it

1 Expert Approved Answer
Step: 1 Unlock blur-text-image
Question Has Been Solved by an Expert!

Get step-by-step solutions from verified subject matter experts

Step: 2 Unlock
Step: 3 Unlock

Students Have Also Explored These Related General Management Questions!