

Question: Question 5 (Unit 4) - 8 marks A doctor's surgery asked for people's opinions about the quality of service given by the practice. Their responses
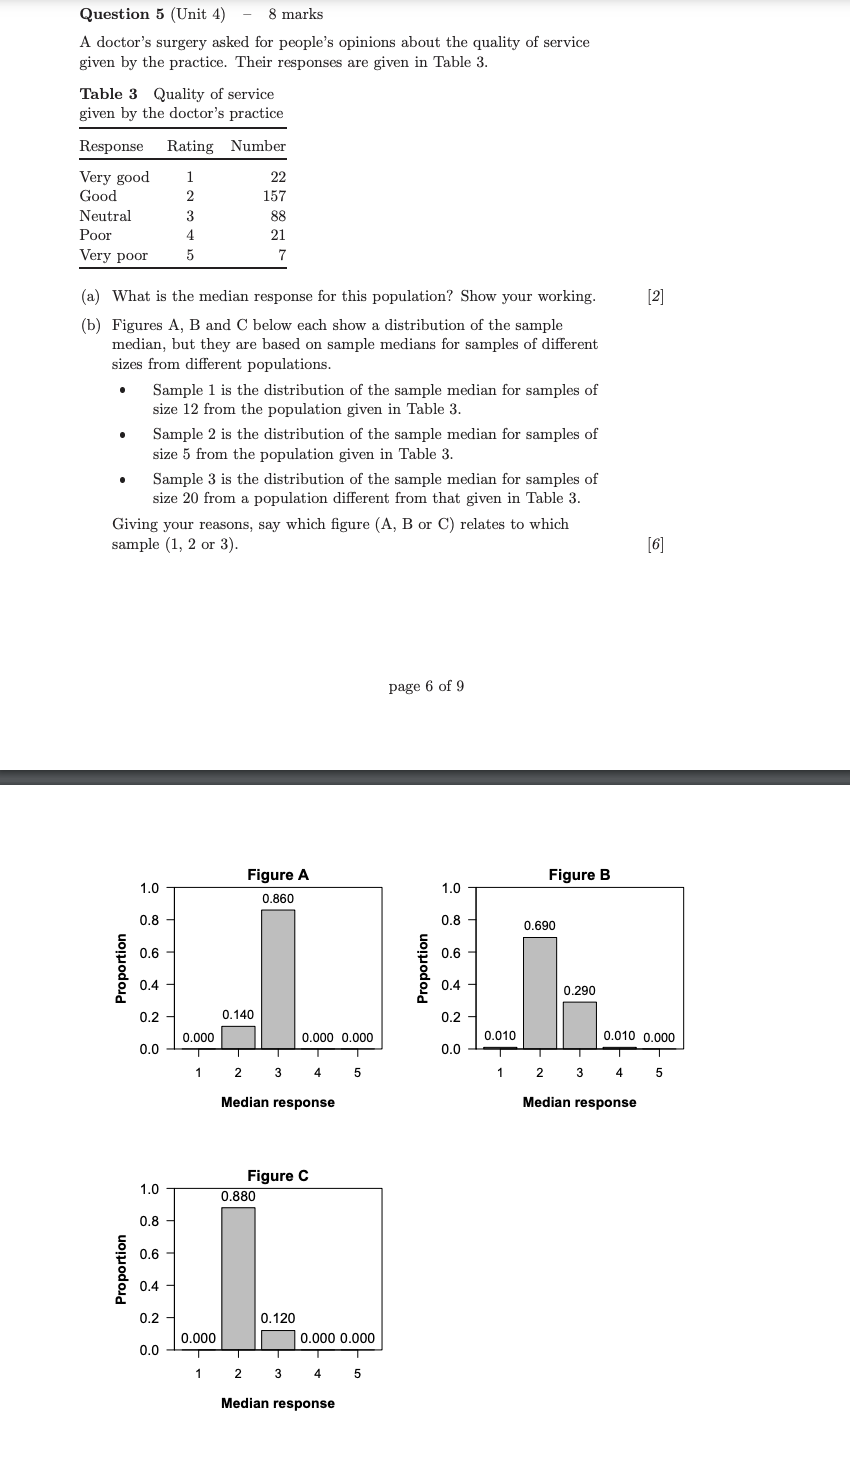
Question 5 (Unit 4) - 8 marks A doctor's surgery asked for people's opinions about the quality of service given by the practice. Their responses are given in Table 3. Table 3 Quality of service given by the doctor's practice Response Rating Number Very good 22 Good 157 Neutral 88 Poor 21 Very poor a) What is the median response for this population? Show your working. [2] b) Figures A, B and C below each show a distribution of the sample median, but they are based on sample medians for samples of different sizes from different populations. . Sample 1 is the distribution of the sample median for samples of size 12 from the population given in Table 3 Sample 2 is the distribution of the sample median for samples of size 5 from the population given in Table 3. Sample 3 is the distribution of the sample median for samples of size 20 from a population different from that given in Table 3. Giving your reasons, say which figure (A, B or C) relates to which sample (1, 2 or 3). [6] page 6 of 9 Figure A Figure B 1.0 1.0 0.860 0.8 0.8 0.690 0.6 0.6 Proportion Proportion 0.4 0.4 0.290 0.2 0.140 0.2 0.000 0.000 0.000 0.010 0.010 0.000 0.0 0.0 2 3 5 2 3 5 Median response Median response Figure C 1.0 0.880 0.8 0.6 Proportion 0.4 0.2 0.120 0.000 0.000 0.000 0.0 2 3 Median response
Step by Step Solution
There are 3 Steps involved in it

Get step-by-step solutions from verified subject matter experts