

Question: Question 6 1 Point In 2016, Bubble Inc. had net income of $500,000, assets of $5,000,000, sales of $2,000,000, and equity of $2,000,000. In 2017,
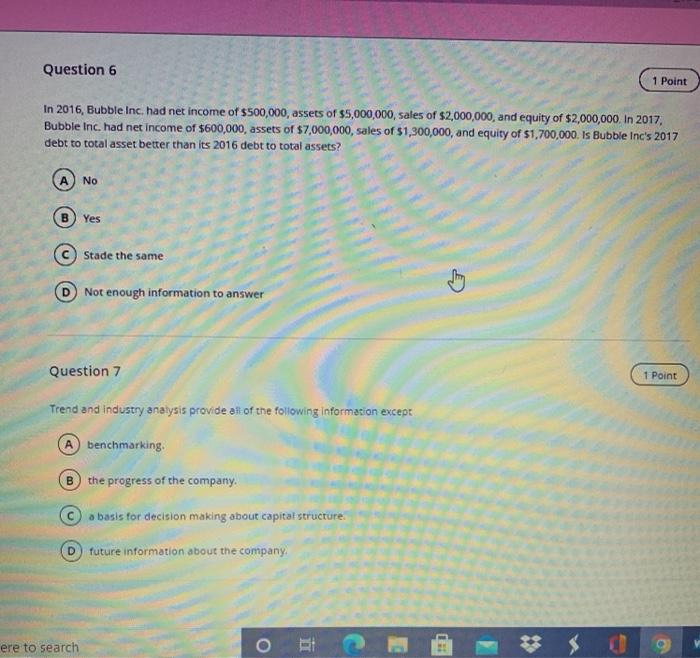
Question 6 1 Point In 2016, Bubble Inc. had net income of $500,000, assets of $5,000,000, sales of $2,000,000, and equity of $2,000,000. In 2017, Bubble Inc. had net income of $600,000, assets of $7,000,000, sales of $1,300,000, and equity of S1,700,000. Is Bubble Inc's 2017 debt to total asset better than its 2016 debt to total assets? No Yes Stade the same Not enough information to answer Question 7 1 Point Trend and industry analysis provide all of the following information except benchmarking B the progress of the company. a basis for decision making about capital structure. D future information about the company, ere to search
Step by Step Solution
There are 3 Steps involved in it

Get step-by-step solutions from verified subject matter experts