

Question: Question 6 1 pts What command is used to add a linear regression line to a scatter plot? O linear O addline O ols_line O
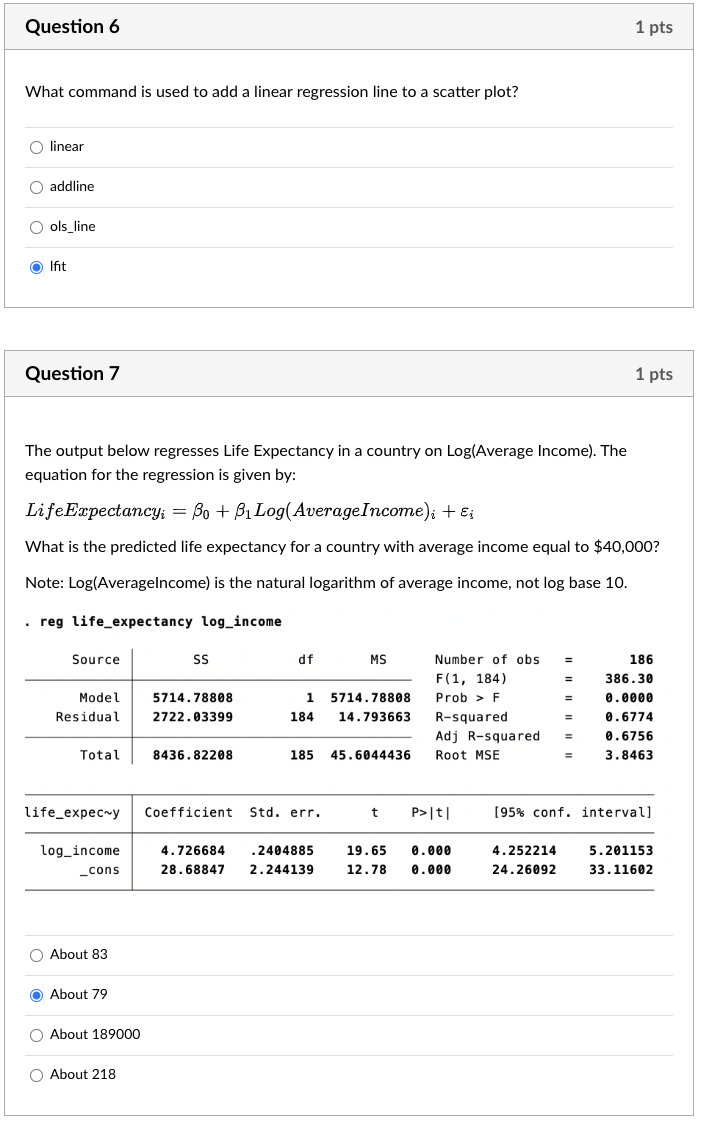
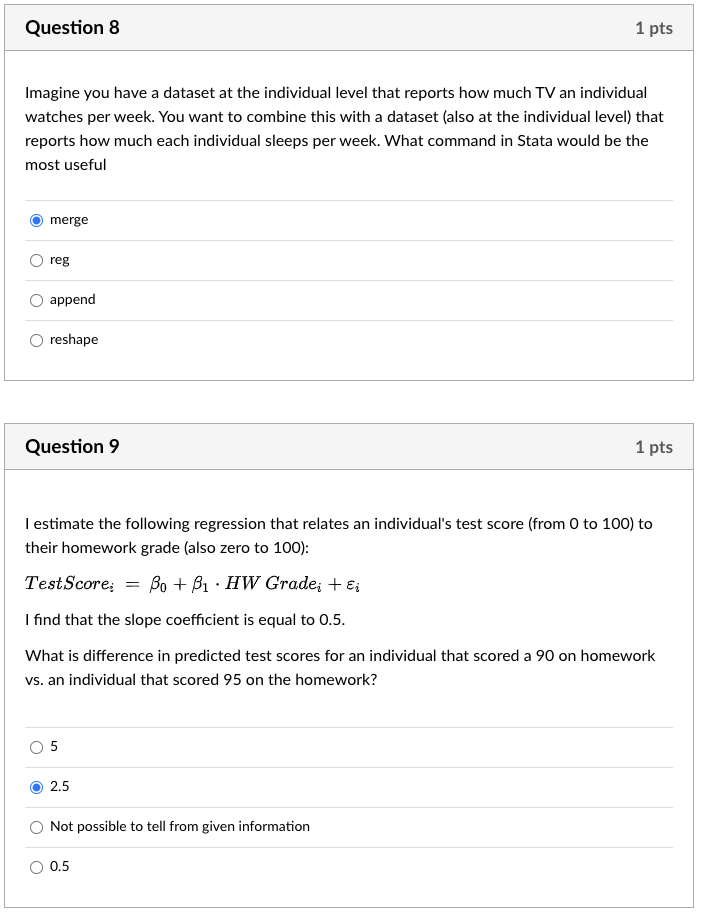
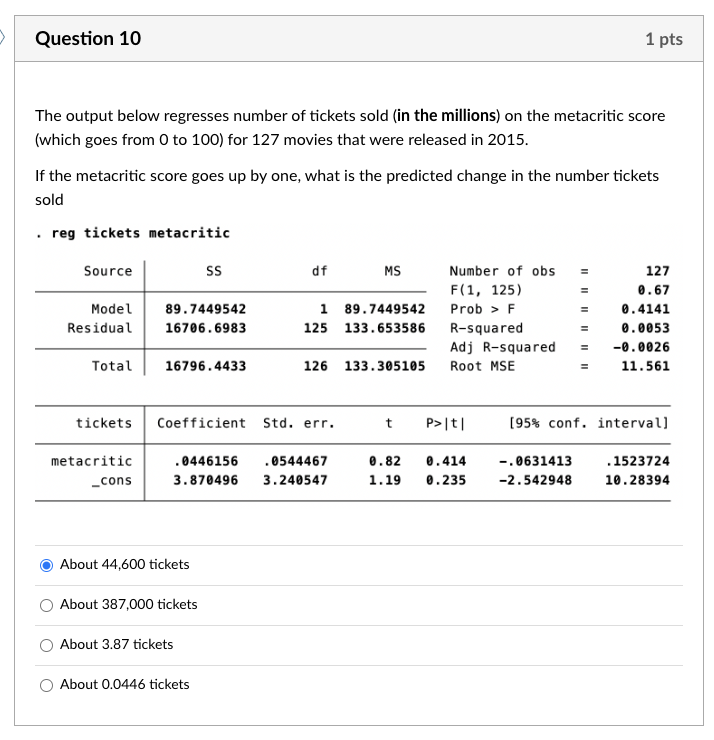
Question 6 1 pts What command is used to add a linear regression line to a scatter plot? O linear O addline O ols_line O Ifit Question 7 1 pts The output below regresses Life Expectancy in a country on Log(Average Income). The equation for the regression is given by: LifeExpectancy; = Bo + B1Log(AverageIncome); + &; What is the predicted life expectancy for a country with average income equal to $40,000? Note: Log(Averageincome) is the natural logarithm of average income, not log base 10. . reg life_expectancy log_income Source SS df MS Number of obs 186 F(1, 184) 386.30 Model 5714. 78808 1 5714. 78808 Prob > F 0. 00.0 Residual 2722. 03399 184 14.793663 R-squared 0 . 6774 Adj R-squared 0 . 6756 Total 8436. 82208 185 45 . 6044436 Root MSE 3. 8463 life_expec~y Coefficient Std. err. t [95% conf. interval] log_income 4. 726684 . 2404885 19. 65 0. 000 4.252214 5. 201153 _cons 28 . 68847 2. 244139 12. 78 0. 000 24.26092 33. 11602 O About 83 O About 79 About 189000 About 218Question 8 1 pts Imagine you have a dataset at the individual level that reports how much TV an individual watches per week. You want to combine this with a dataset (also at the individual level) that reports how much each individual sleeps per week. What command in Stata would be the most useful ) merge () reg () append () reshape Question 9 1 pts | estimate the following regression that relates an individual's test score (from 0 to 100) to their homework grade (also zero to 100): TestScore; = By + fr - HW Grade; + | find that the slope coefficient is equal to 0.5. What is difference in predicted test scores for an individual that scored a 20 on homework vs. an individual that scored 25 on the homework? @ 2.5 (_) Not possible to tell from given information ) 0.5 Question 10 1 pts The output below regresses number of tickets sold (in the millions) on the metacritic score (which goes from 0 to 100) for 127 movies that were released in 2015. If the metacritic score goes up by one, what is the predicted change in the number tickets sold reg tickets metacritic Source SS df MS Number of obs 127 F (1, 125) iI ii II 0.67 Model 89 . 7449542 1 89.7449542 Prob > F 0. 4141 Residual 16706.6983 125 133.653586 R-squared 0. 0053 Adj R-squared -0. 0026 Total 16796.4433 126 133.305105 Root MSE 11. 561 tickets Coefficient Std. err. t P>It| [95% conf. interval] metacritic . 0446156 . 0544467 0. 82 0 . 414 -. 0631413 1523724 _cons 3. 870496 3.240547 1. 19 0. 235 -2.542948 10.28394 O About 44,600 tickets O About 387,000 tickets O About 3.87 tickets O About 0.0446 tickets
Step by Step Solution
There are 3 Steps involved in it

Get step-by-step solutions from verified subject matter experts