

Question: Question 6 9.5 Hypothesis Testing for Proportions Using the p-Value (Z-test) Many investors and financial analysts believe the Dow Jones Industrial Average (DJIA) gives a
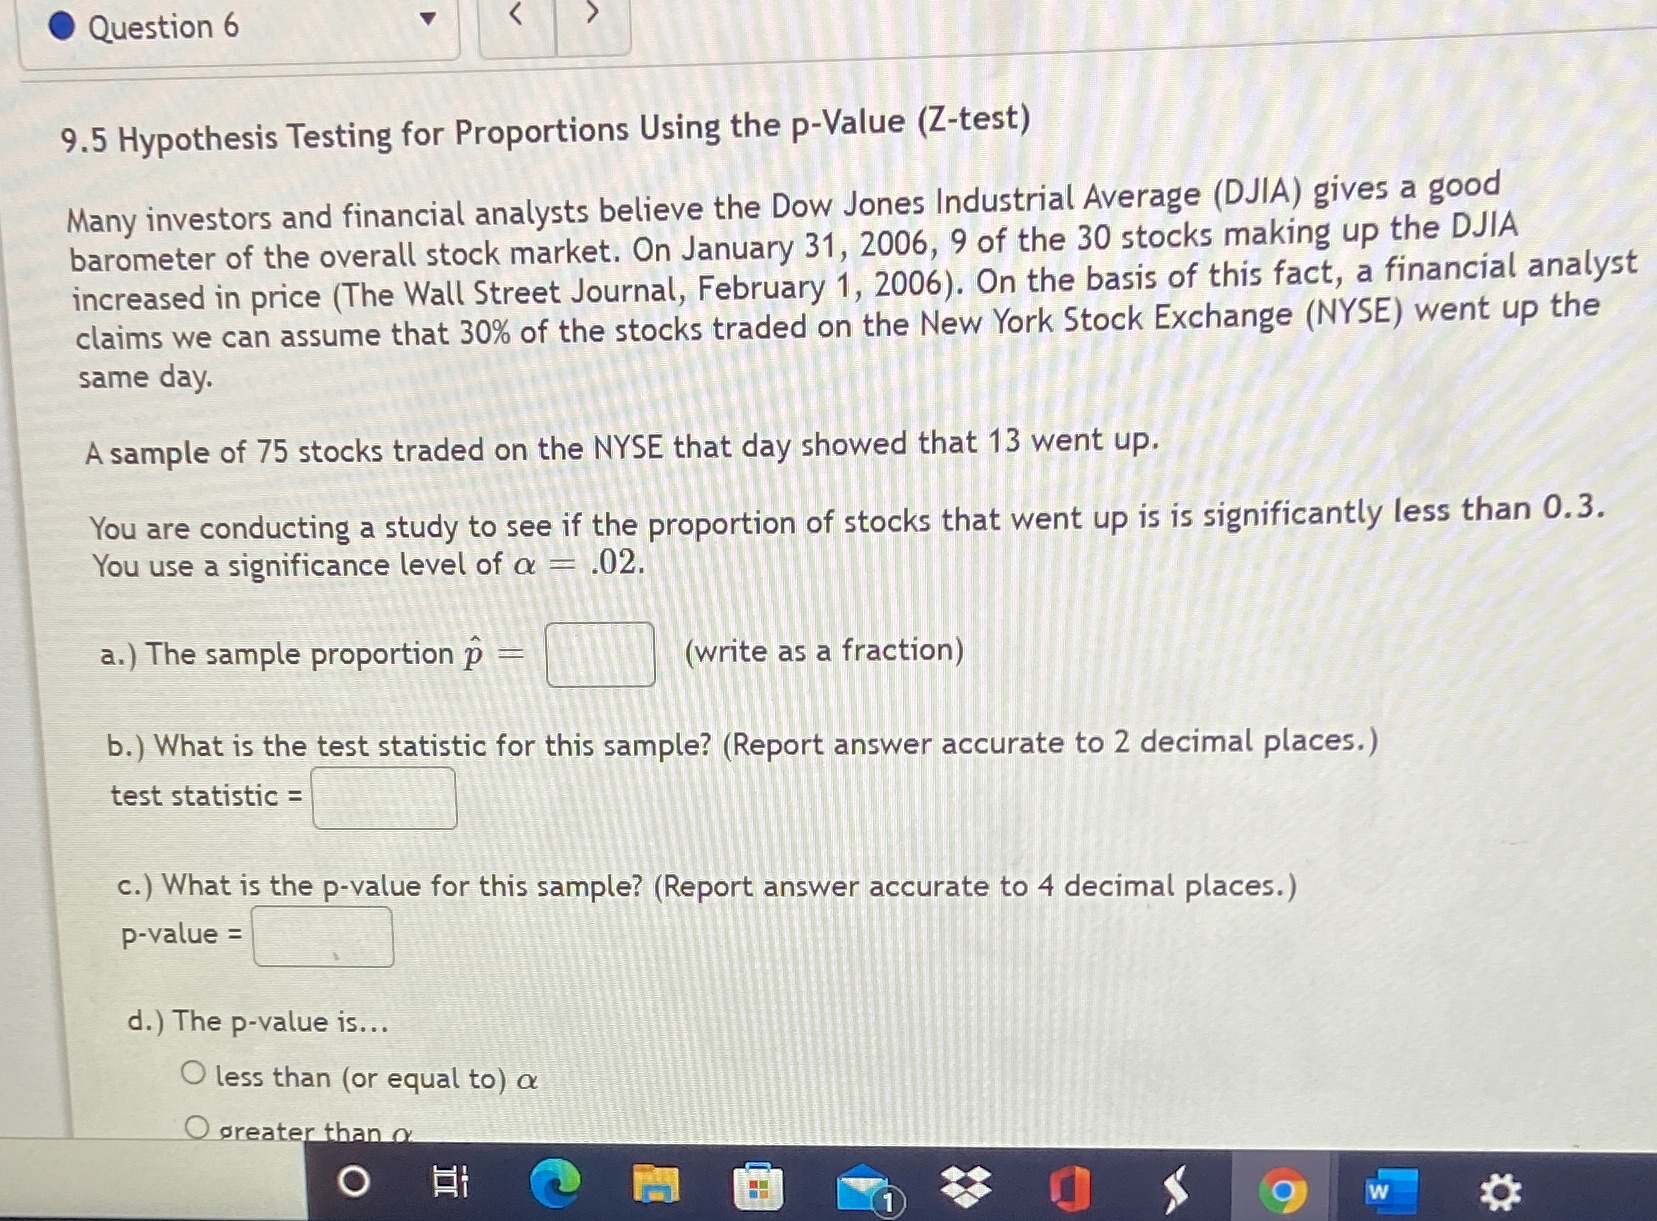
Question 6 9.5 Hypothesis Testing for Proportions Using the p-Value (Z-test) Many investors and financial analysts believe the Dow Jones Industrial Average (DJIA) gives a good barometer of the overall stock market. On January 31, 2006, 9 of the 30 stocks making up the DJIA increased in price (The Wall Street Journal, February 1, 2006). On the basis of this fact, a financial analyst claims we can assume that 30% of the stocks traded on the New York Stock Exchange (NYSE) went up the same day. A sample of 75 stocks traded on the NYSE that day showed that 13 went up. You are conducting a study to see if the proportion of stocks that went up is is significantly less than 0.3. You use a significance level of a = .02. a.) The sample proportion p (write as a fraction) b. ) What is the test statistic for this sample? (Report answer accurate to 2 decimal places.) test statistic = c.) What is the p-value for this sample? (Report answer accurate to 4 decimal places.) p-value = d. ) The p-value is... O less than (or equal to) a O greater than o O W
Step by Step Solution
There are 3 Steps involved in it

Get step-by-step solutions from verified subject matter experts