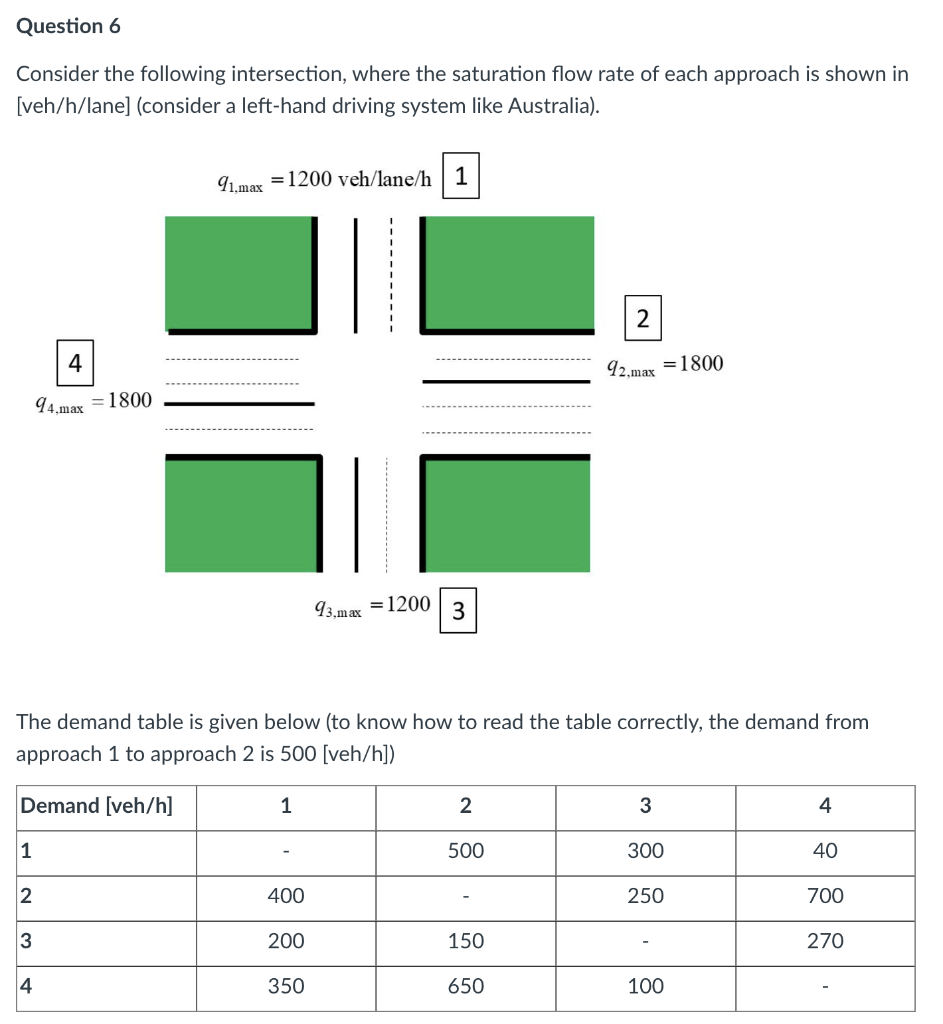
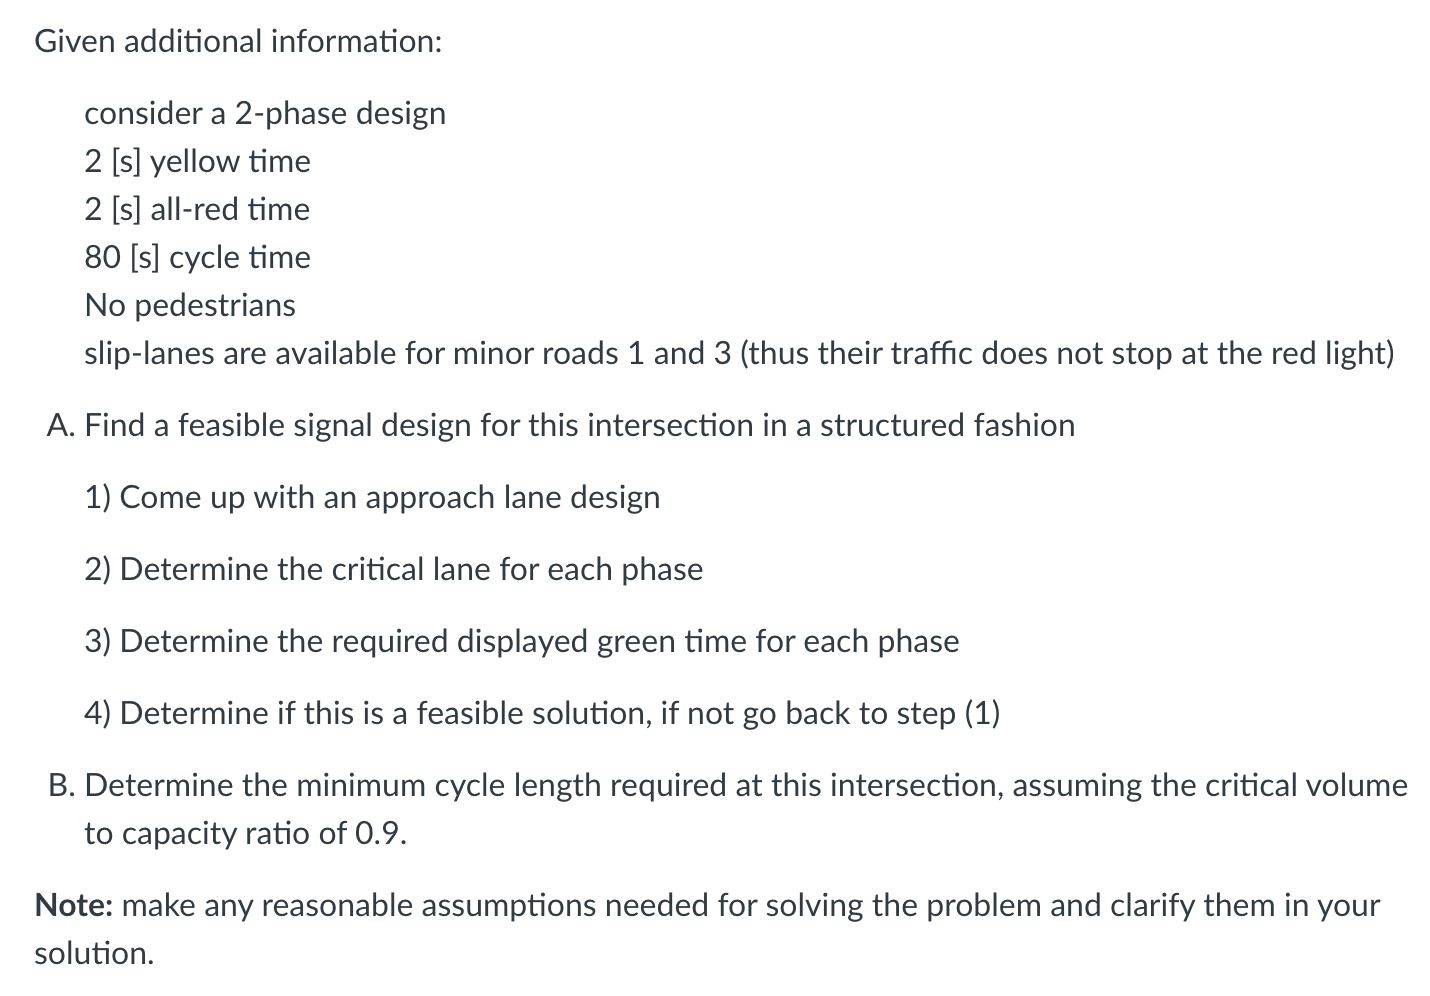
Question: Question 6 Consider the following intersection, where the saturation flow rate of each approach is shown in [veh/h/lane] (consider a left-hand driving system like Australia).

Question 6 Consider the following intersection,Question 6 Consider the following intersection,

Question 6 Consider the following intersection, where the saturation flow rate of each approach is shown in [veh/h/lane] (consider a left-hand driving system like Australia). 91.max = 1200 veh/lane/h 1 2 92,max 4 = 1800 94,max = 1800 93.max = 1200 3 The demand table is given below (to know how to read the table correctly, the demand from approach 1 to approach 2 is 500 [veh/h]) Demand [veh/h] 1 2 3 4 1 500 300 40 2 400 250 700 3 200 150 270 4 350 650 100 Given additional information: consider a 2-phase design 2 [s] yellow time 2 [s] all-red time 80 [s] cycle time No pedestrians slip-lanes are available for minor roads 1 and 3 (thus their traffic does not stop at the red light) A. Find a feasible signal design for this intersection in a structured fashion 1) Come up with an approach lane design 2) Determine the critical lane for each phase 3) Determine the required displayed green time for each phase 4) Determine if this is a feasible solution, if not go back to step (1) B. Determine the minimum cycle length required at this intersection, assuming the critical volume to capacity ratio of 0.9. Note: make any reasonable assumptions needed for solving the problem and clarify them in your solution

Step by Step Solution

There are 3 Steps involved in it

1 Expert Approved Answer
Step: 1 Unlock blur-text-image
Question Has Been Solved by an Expert!

Get step-by-step solutions from verified subject matter experts

Step: 2 Unlock
Step: 3 Unlock

Students Have Also Explored These Related General Management Questions!