

Question: QUESTION 6 Consider the process workload described below. Draw the Gnatt Diagram for a Round Robin schedule of this workload. Assume the time quantum
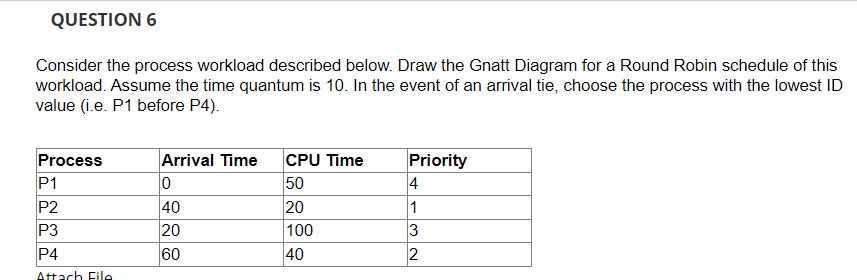
QUESTION 6 Consider the process workload described below. Draw the Gnatt Diagram for a Round Robin schedule of this workload. Assume the time quantum is 10. In the event of an arrival tie, choose the process with the lowest ID value (i.e. P1 before P4). Process P1 P2 P3 P4 Attach File Arrival Time 0 40 20 60 CPU Time 50 20 100 40 Priority 4 1 3 2
Step by Step Solution
★★★★★
3.49 Rating (156 Votes )
There are 3 Steps involved in it
1 Expert Approved Answer
Step: 1 Unlock

Certainly Lets create the Gantt Chart for the given process workload using Round Robin scheduling wi... View full answer
Question Has Been Solved by an Expert!
Get step-by-step solutions from verified subject matter experts
Step: 2 Unlock
Step: 3 Unlock