

Question: Question #6 Construct a Cost-Volume-Profit Analysis graph based on the $figures provided: Scenario #1 Scenario #2 Scenario #3 Scenario #4 Price per unit $8/unit $8/unit
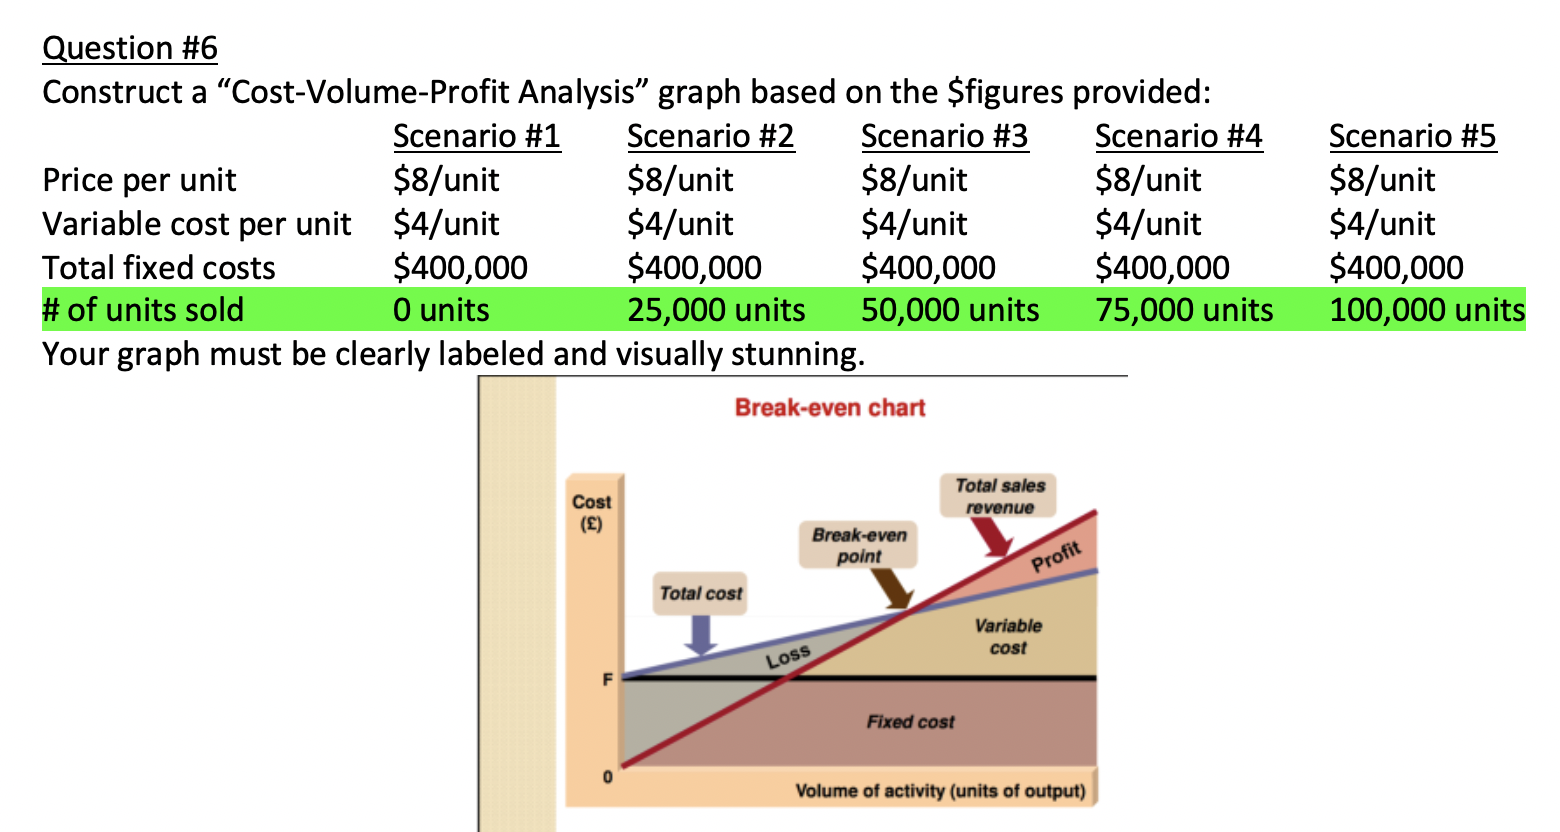
Question #6 Construct a "Cost-Volume-Profit Analysis graph based on the $figures provided: Scenario #1 Scenario #2 Scenario #3 Scenario #4 Price per unit $8/unit $8/unit $8/unit $8/unit Variable cost per unit $4/unit $4/unit $4/unit $4/unit Total fixed costs $400,000 $400,000 $400,000 $400,000 # of units sold O units 25,000 units 50,000 units 75,000 units Your graph must be clearly labeled and visually stunning. Break-even chart Scenario #5 $8/unit $4/unit $400,000 100,000 units Cost Total sales revenue () Break-even point Profit Total cost Variable cost Loss Fixed cost Volume of activity (units of output)
Step by Step Solution
There are 3 Steps involved in it
1 Expert Approved Answer
Step: 1 Unlock

Question Has Been Solved by an Expert!
Get step-by-step solutions from verified subject matter experts
Step: 2 Unlock
Step: 3 Unlock