

Question: QUESTION 6: Depending on the above questions results, using Excel application, make a table summarizing all the financial ratios groups that you have calculated and
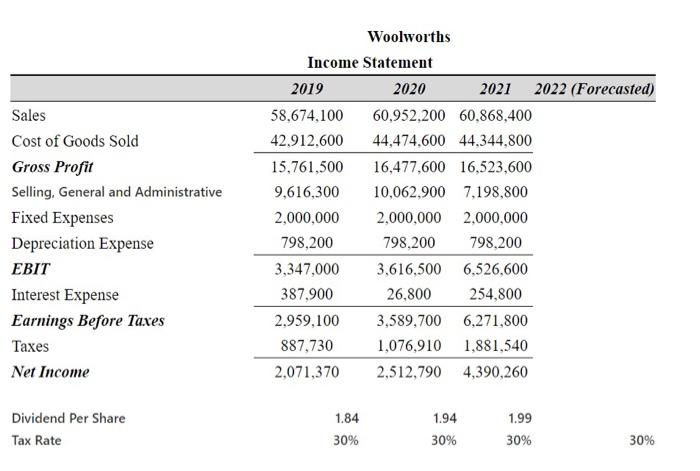
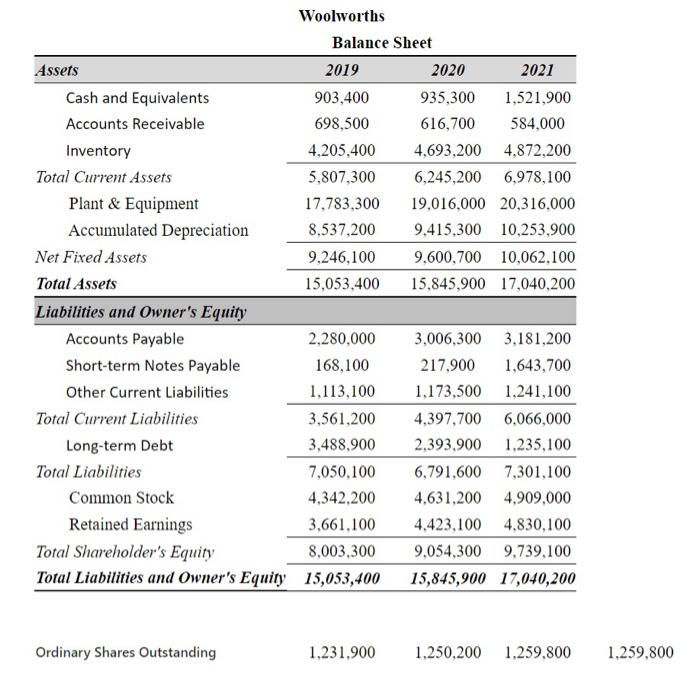
Sales Cost of Goods Sold Gross Profit Selling, General and Administrative Fixed Expenses Depreciation Expense EBIT Interest Expense Earnings Before Taxes Taxes Net Income Woolworths Income Statement 2019 2020 2021 2022 (Forecasted) 58,674,100 60,952.200 60.868,400 42,912,600 44,474,600 44,344,800 15,761,500 16,477,600 16,523,600 9,616,300 10,062,900 7,198,800 2,000,000 2,000,000 2,000,000 798,200 798,200 798.200 3,347,000 3,616,500 6,526,600 387,900 26,800 254,800 2.959,100 3,589,700 6,271,800 887,730 1,076,910 1,881,540 2,071,370 2,512,790 4,390,260 Dividend Per Share Tax Rate 1.84 30% 1.94 30% 1.99 30% 30% Woolworths Balance Sheet Assets 2019 2020 2021 Cash and Equivalents 903,400 935,300 1,521,900 Accounts Receivable 698,500 616,700 584,000 Inventory 4,205,400 4,693,200 4.872,200 Total Current Assets 5,807,300 6,245,200 6,978,100 Plant & Equipment 17,783,300 19,016,000 20,316,000 Accumulated Depreciation 8,537,200 9,415,300 10,253,900 Net Fixed Assets 9,246.100 9,600,700 10,062,100 Total Assets 15,053,400 15,845,900 17,040,200 Liabilities and Owner's Equity Accounts Payable 2.280,000 3,006,300 3,181,200 Short-term Notes Payable 168,100 217.900 1,643,700 Other Current Liabilities 1,113,100 1,173,500 1,241,100 Total Current Liabilities 3,561,200 4,397,700 6,066,000 Long-term Debt 3,488.900 2,393,900 1,235,100 Total Liabilities 7,050,100 6,791,600 7,301,100 Common Stock 4,342,200 4.631,200 4.909,000 Retained Earnings 3,661,100 4,423,100 4,830,100 Total Shareholder's Equity 8,003,300 9,054,300 9,739,100 Total Liabilities and Owner's Equity 15,053,400 15,845,900 17,040,200 Ordinary Shares Outstanding 1,231,900 1.250,200 1.259.800 1.259,800 Sales Cost of Goods Sold Gross Profit Selling, General and Administrative Fixed Expenses Depreciation Expense EBIT Interest Expense Earnings Before Taxes Taxes Net Income Woolworths Income Statement 2019 2020 2021 2022 (Forecasted) 58,674,100 60,952.200 60.868,400 42,912,600 44,474,600 44,344,800 15,761,500 16,477,600 16,523,600 9,616,300 10,062,900 7,198,800 2,000,000 2,000,000 2,000,000 798,200 798,200 798.200 3,347,000 3,616,500 6,526,600 387,900 26,800 254,800 2.959,100 3,589,700 6,271,800 887,730 1,076,910 1,881,540 2,071,370 2,512,790 4,390,260 Dividend Per Share Tax Rate 1.84 30% 1.94 30% 1.99 30% 30% Woolworths Balance Sheet Assets 2019 2020 2021 Cash and Equivalents 903,400 935,300 1,521,900 Accounts Receivable 698,500 616,700 584,000 Inventory 4,205,400 4,693,200 4.872,200 Total Current Assets 5,807,300 6,245,200 6,978,100 Plant & Equipment 17,783,300 19,016,000 20,316,000 Accumulated Depreciation 8,537,200 9,415,300 10,253,900 Net Fixed Assets 9,246.100 9,600,700 10,062,100 Total Assets 15,053,400 15,845,900 17,040,200 Liabilities and Owner's Equity Accounts Payable 2.280,000 3,006,300 3,181,200 Short-term Notes Payable 168,100 217.900 1,643,700 Other Current Liabilities 1,113,100 1,173,500 1,241,100 Total Current Liabilities 3,561,200 4,397,700 6,066,000 Long-term Debt 3,488.900 2,393,900 1,235,100 Total Liabilities 7,050,100 6,791,600 7,301,100 Common Stock 4,342,200 4.631,200 4.909,000 Retained Earnings 3,661,100 4,423,100 4,830,100 Total Shareholder's Equity 8,003,300 9,054,300 9,739,100 Total Liabilities and Owner's Equity 15,053,400 15,845,900 17,040,200 Ordinary Shares Outstanding 1,231,900 1.250,200 1.259.800 1.259,800
Step by Step Solution
There are 3 Steps involved in it

Get step-by-step solutions from verified subject matter experts