

Question: QUESTION 6 In question 3, the upper control limit (UCL) of R bar chart is (refer to the following table if needed). Keep two decimals
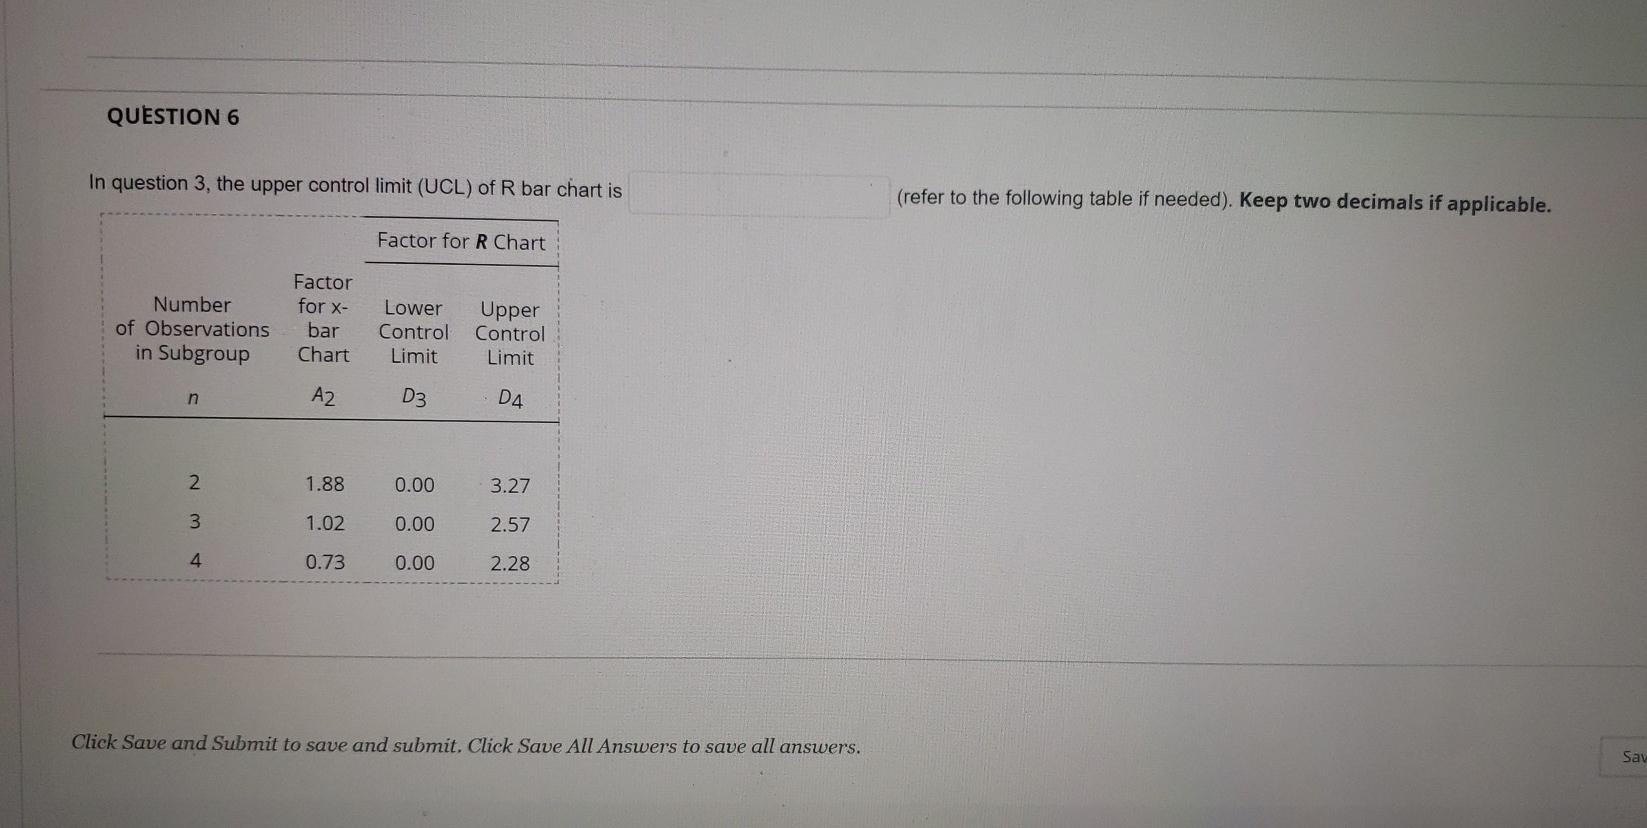
QUESTION 6 In question 3, the upper control limit (UCL) of R bar chart is (refer to the following table if needed). Keep two decimals if applicable. Factor for R Chart Number of Observations in Subgroup Factor for X- bar Chart Lower Control Limit Upper Control Limit n A2 D3 D4 2 1.88 0.00 3.27 3 1.02 0.00 2.57 4. 0.73 0.00 2.28 Click Save and Submit to save and submit. Click Save All Answers to save all answers. Sav QUESTION 6 In question 3, the upper control limit (UCL) of R bar chart is (refer to the following table if needed). Keep two decimals if applicable. Factor for R Chart Number of Observations in Subgroup Factor for X- bar Chart Lower Control Limit Upper Control Limit n A2 D3 D4 2 1.88 0.00 3.27 3 1.02 0.00 2.57 4. 0.73 0.00 2.28 Click Save and Submit to save and submit. Click Save All Answers to save all answers. Sav
Step by Step Solution
There are 3 Steps involved in it
1 Expert Approved Answer
Step: 1 Unlock

Question Has Been Solved by an Expert!
Get step-by-step solutions from verified subject matter experts
Step: 2 Unlock
Step: 3 Unlock