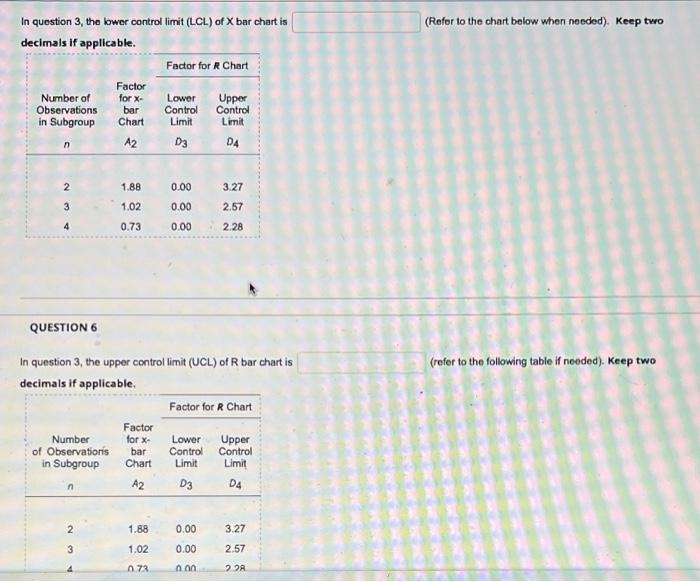
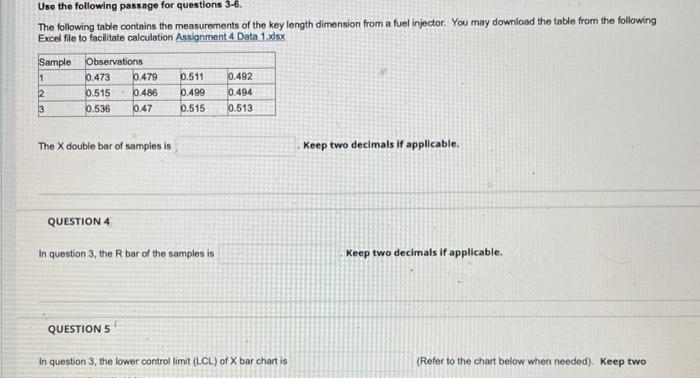
Question: (Refer to the chart below when needed). Keep two In question 3, the lower control limit (LCL) of X bar chart is decimals if applicable.

(Refer to the chart below when needed). Keep two
(Refer to the chart below when needed). Keep two In question 3, the lower control limit (LCL) of X bar chart is decimals if applicable. Factor for R Chart Number of Observations in Subgroup Factor for X- bar Chart Lower Control Limit Upper Control Limit D4 n A2 D3 2 1.88 0.00 3.27 3 1.02 0.00 2.57 4 0.73 0.00 2.28 QUESTION 6 (refer to the following table if needed). Keep two In question 3, the upper control limit (UCL) of R bar chart is decimals if applicable Factor for R Chart Factor Number for x- Lower Upper of Observationis bar Control Control in Subgroup Chart Limit Limit A2 D3 D4 2 1.88 0.00 3.27 3 0.00 2.57 1.02 073 non 22 Use the following passage for questions 3-6. The following table contains the measurements of the key length dimension from a fuel injector. You may download the table from the following Excel file to facilitate calculation Assignment 4 Data 1 xdsx Sample 11 Observations 0.473 6.479 6.515 6.486 6.536 6.47 2 3 0.511 0.499 0.515 0.492 0.494 0.513 The X double bar of samples is Keep two decimals if applicable. QUESTION 4 In question 3, the bar of the samples is Keep two decimals if applicable. QUESTION 5 In question 3, the lower control limit (LCL) of X bar chart is (Refer to the chart below when needed). Keep two

Step by Step Solution

There are 3 Steps involved in it

1 Expert Approved Answer
Step: 1 Unlock blur-text-image
Question Has Been Solved by an Expert!

Get step-by-step solutions from verified subject matter experts

Step: 2 Unlock
Step: 3 Unlock

Students Have Also Explored These Related General Management Questions!