

Question: Question 6 points Create a complete line graph of the data below that shows revenue over time with TIME as the X-axis. points a) Which
Question 6
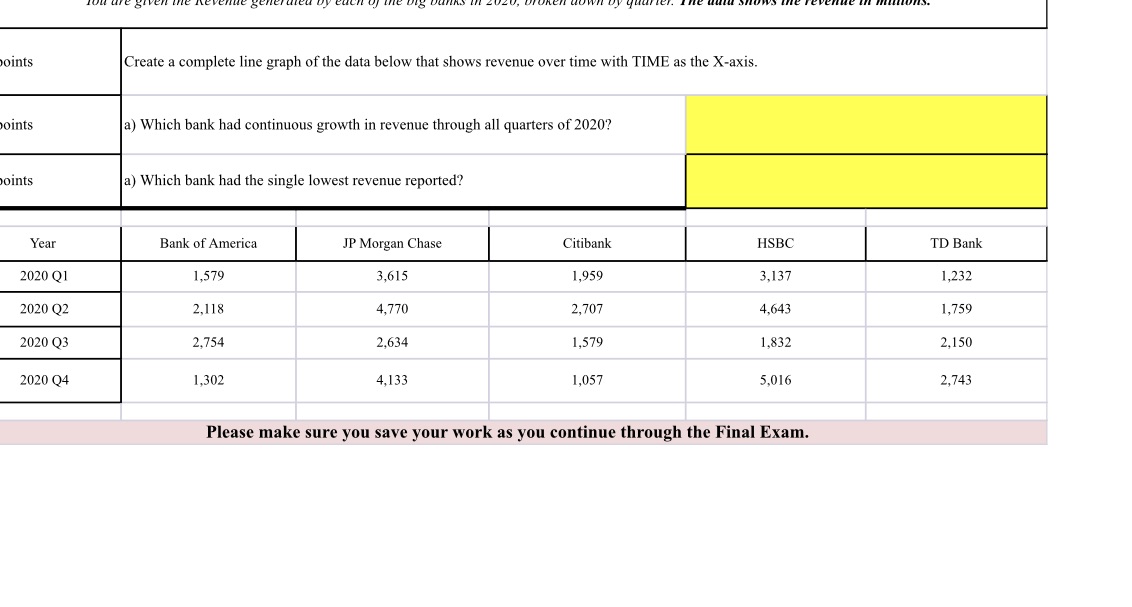
points Create a complete line graph of the data below that shows revenue over time with TIME as the X-axis. points a) Which bank had continuous growth in revenue through all quarters of 2020? points a) Which bank had the single lowest revenue reported? Year Bank of America JP Morgan Chase Citibank HSBC TD Bank 2020 Q1 1,579 3,615 1,959 3,137 1,232 2020 Q2 2,118 4,770 2,707 4.643 1,759 2020 Q3 2,754 2,634 1,579 1,832 2,150 2020 Q4 1,302 4,133 1,057 5.016 2,743 Please make sure you save your work as you continue through the Final Exam
Step by Step Solution
There are 3 Steps involved in it
1 Expert Approved Answer
Step: 1 Unlock

Question Has Been Solved by an Expert!
Get step-by-step solutions from verified subject matter experts
Step: 2 Unlock
Step: 3 Unlock