

Question: QUESTION 6 This scatterplot shows a correlation where r = +.88. 10 20 30 40 So Suppose an outlier was added to this scatterplot. Which
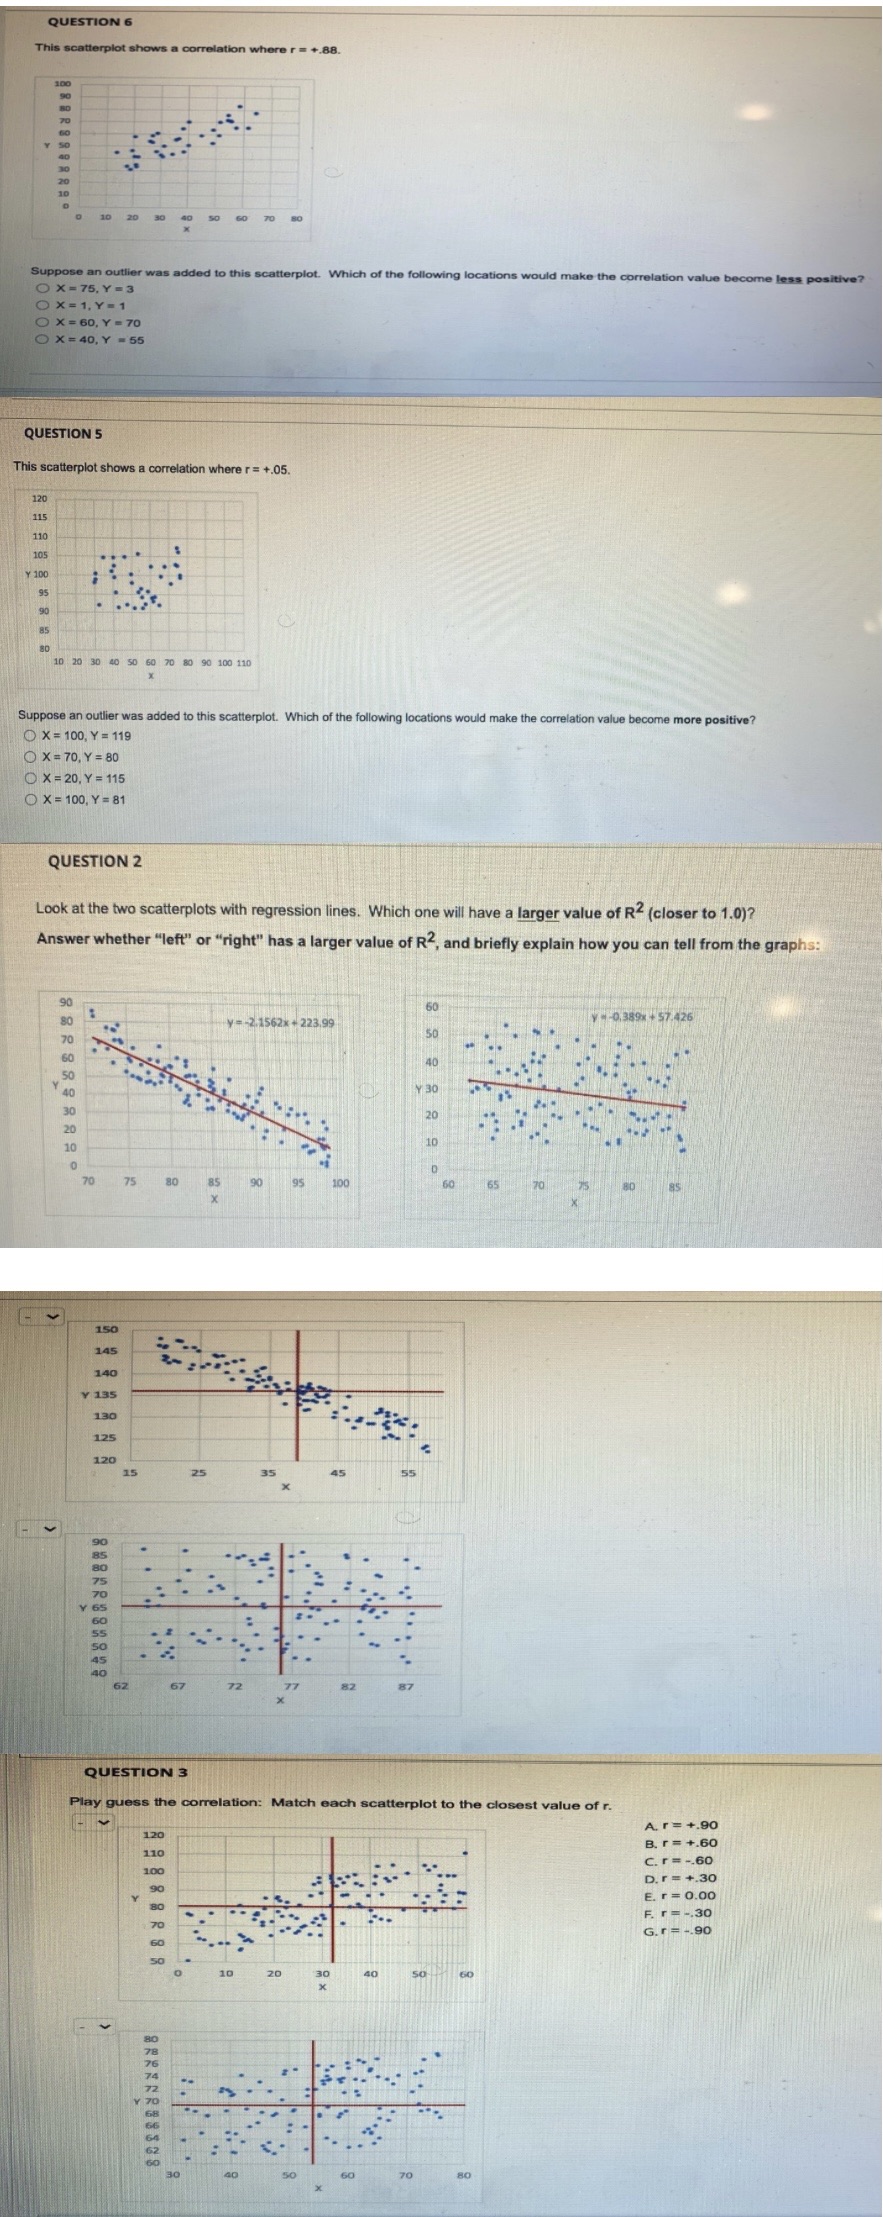
QUESTION 6 This scatterplot shows a correlation where r = +.88. 10 20 30 40 So Suppose an outlier was added to this scatterplot. Which of the foll me less pos O X = 75, Y = 3 O X = 1, Y=1 O X = 60, Y = 70 O X = 40, Y - 55 QUESTION 5 This scatterplot shows a correlation where r = +.05. 120 115 110 105 100 8 8 80 10 20 30 40 50 60 70 80 90 100 110 Suppose an outlier was added to this scatterplot. Which of the following locations would make the correlation value become more positive? O X = 100, Y = 119 O X = 70, Y =80 O X = 20, Y = 115 O X = 100, Y = 81 QUESTION 2 Look at the two scatterplots with regression lines. Which one will have a larger value of R2 (closer to 1.0)? Answer whether "left" or "right" has a larger value of R2, and briefly explain how you can tell from the graphs: 8 y - -2.1562x - 223.99 40 30 .5 8 8 868 8 8 20 10 70 75 85 100 60 70 150 145 140 Y 135 130 125 120 15 25 35 45 55 v BAN80888 67 72 QUESTION 3 Play guess the correlation: Match each scatterplot to the closest value of r. Ar= +.90 120 B. r = +.60 110 Cr=-60 100 D.r = +.30 E. r = 0.00 F. F=-.30 G.r = -.90 6 8 82 10 70 40 50 60
Step by Step Solution
There are 3 Steps involved in it

Get step-by-step solutions from verified subject matter experts