

Question: Question 6 (Unit 5) 17 marks You will need to use Minitab to answer this question- The Minitab le that you require for this question
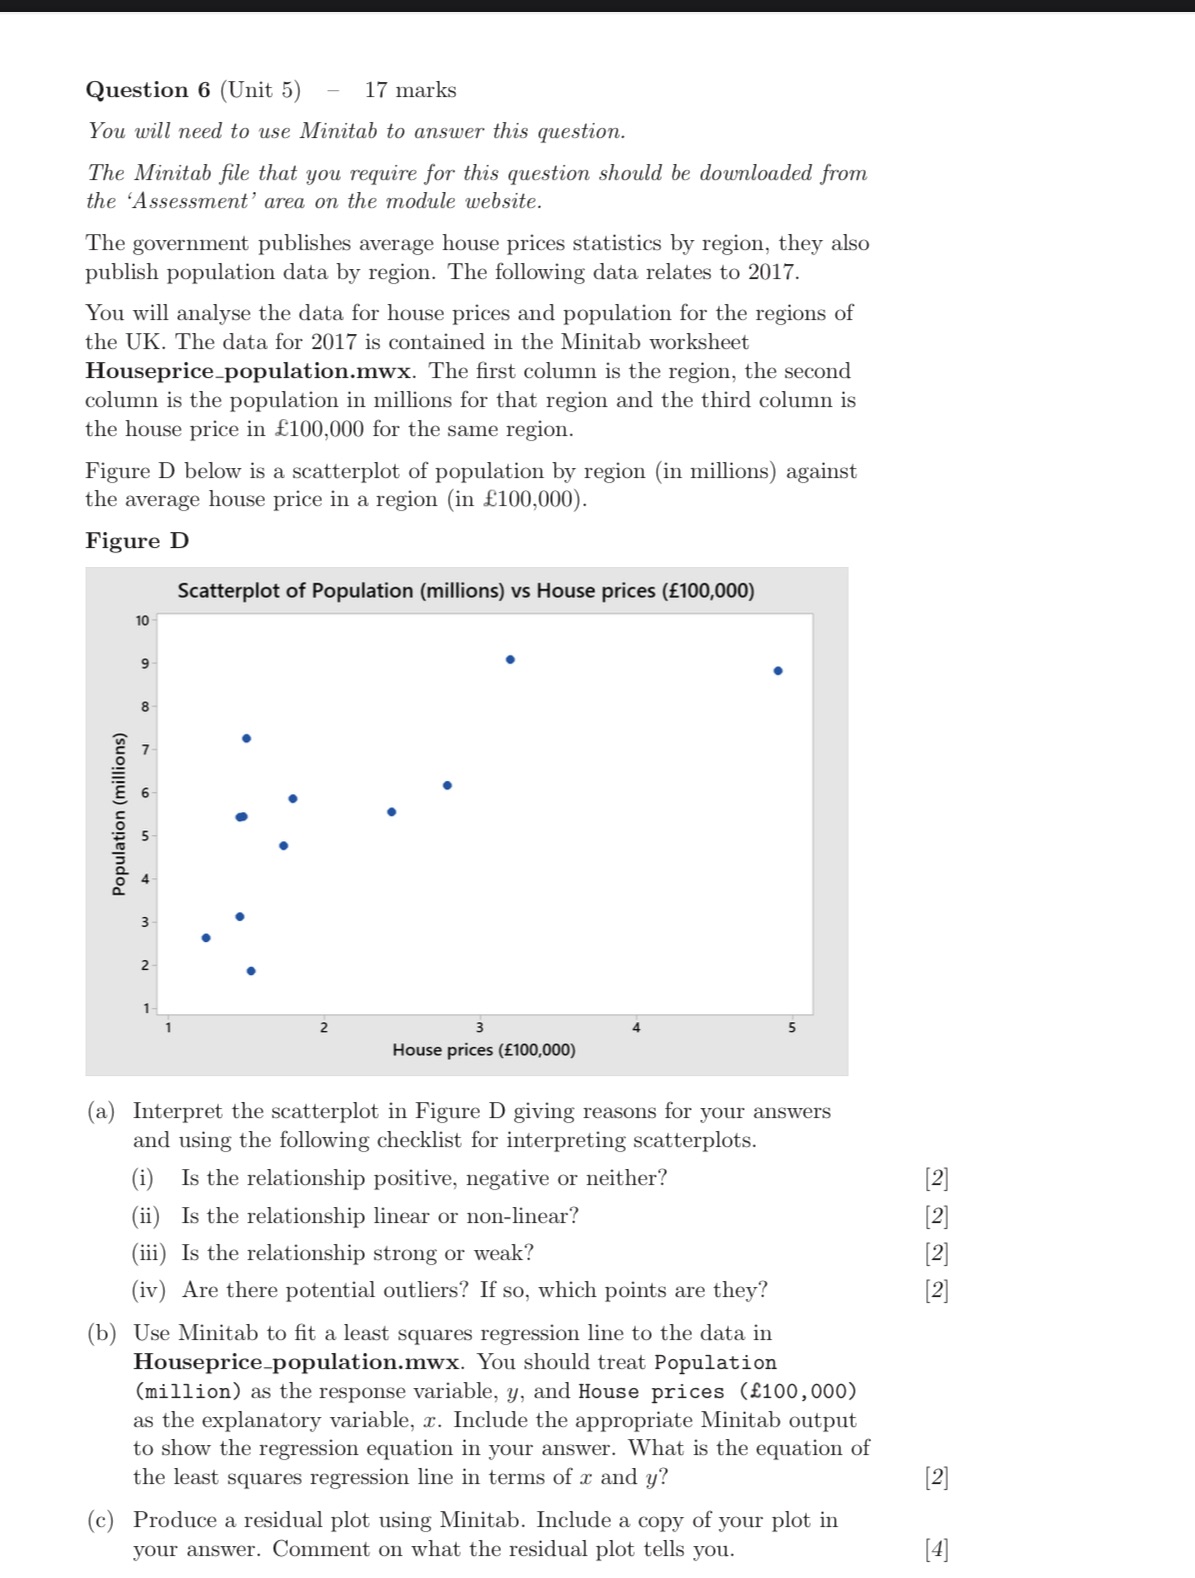
Question 6 (Unit 5) 17 marks You will need to use Minitab to answer this question- The Minitab le that you require for this question should be doumloaded 'om the 'Assessment' area on the module website. The government publishes average house prices statistics by region, they also publish population data by region. The following data relates to 2017. You will analyse the data for house prices and population for the regions of the UK. The data for 2017 is contained in the Minitab worksheet Houseprice_population.mwx. The rst column is the region, the second column is the population in millions for that region and the third column is the house price in 100,000 for the same region. Figure D below is a scatterplot of population by region (in millions) against the average house price in a region (in 100,000). Figure D Scatterplot of Population (millions) vs Home prices (100,000) Population (millions) I I i .5. i s' ' Houseprioellmom (a) Interpret the scatterplot in Figure D giving reasons for your answers and using the following checklist for interpreting scatterplots. (i) Is the relationship positive, negative or neither? (ii) Is the relationship linear or nonlinear? (iii) Is the relationship strong or weak? (iv) Are there potential outliers? If so, which points are they? (b) Use Minitab to t a least squares regression line to the data in Houseprice_population.n1wx. You should treat Population (million) as the response variable, y, and House prices (100,000) as the explanatory variable, :3. Include the appropriate Minitab output to show the regression equation in your answer. What is the equation of the least squares regression line in terms of a: and y? (c) Produce a residual plot using Minitab. Include a copy of your plot in your answer. Comment on what the residual plot tells you. [2] [2] [2] [4]
Step by Step Solution
There are 3 Steps involved in it

Get step-by-step solutions from verified subject matter experts