

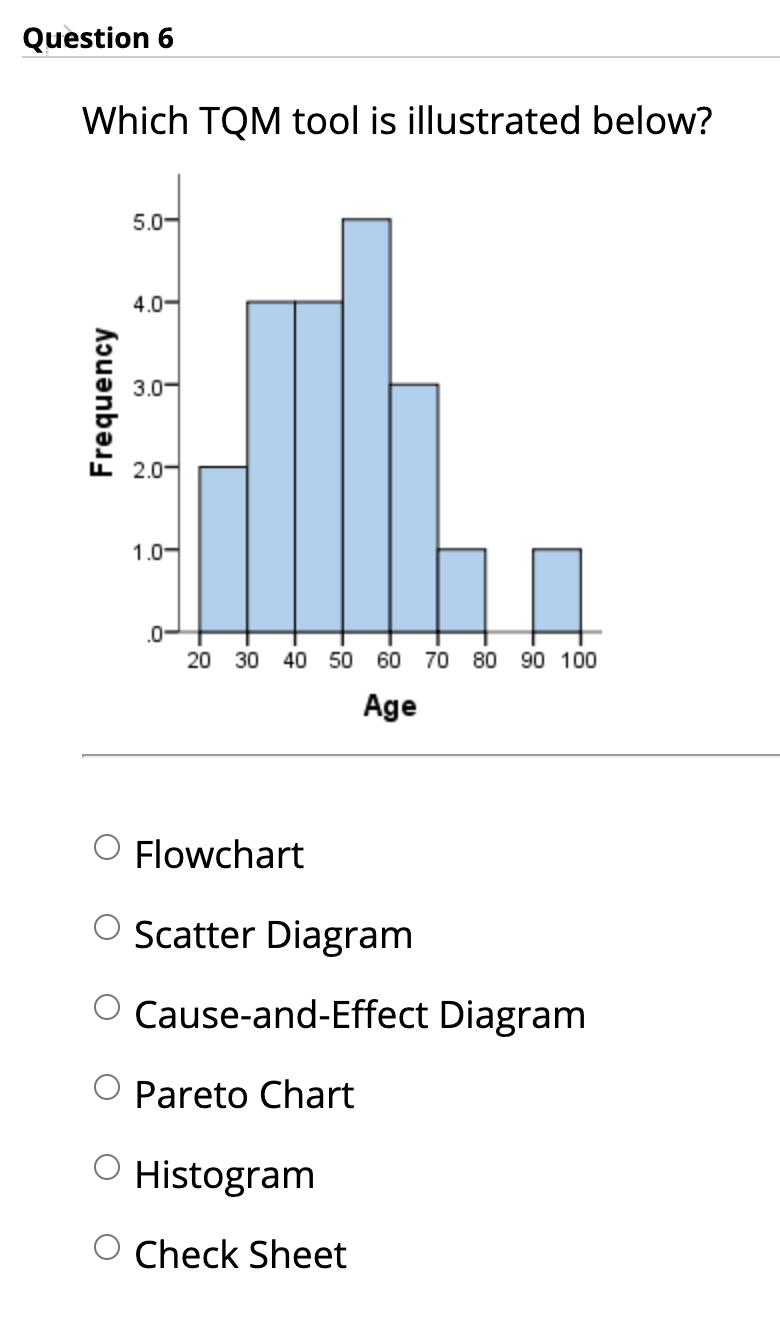
Question: Question 6 Which TQM tool is illustrated below? 5.0- 4.0- 3.0 Frequency 2.09 1.09 .0 20 30 40 50 60 70 80 90 100 Age
Step by Step Solution
There are 3 Steps involved in it
1 Expert Approved Answer
Step: 1 Unlock

Question Has Been Solved by an Expert!
Get step-by-step solutions from verified subject matter experts
Step: 2 Unlock
Step: 3 Unlock