

Question: QUESTION 7 1 po Graphically, Consumers' Surplus in a market is shown as the area above the market price and beneath the demand curve. the

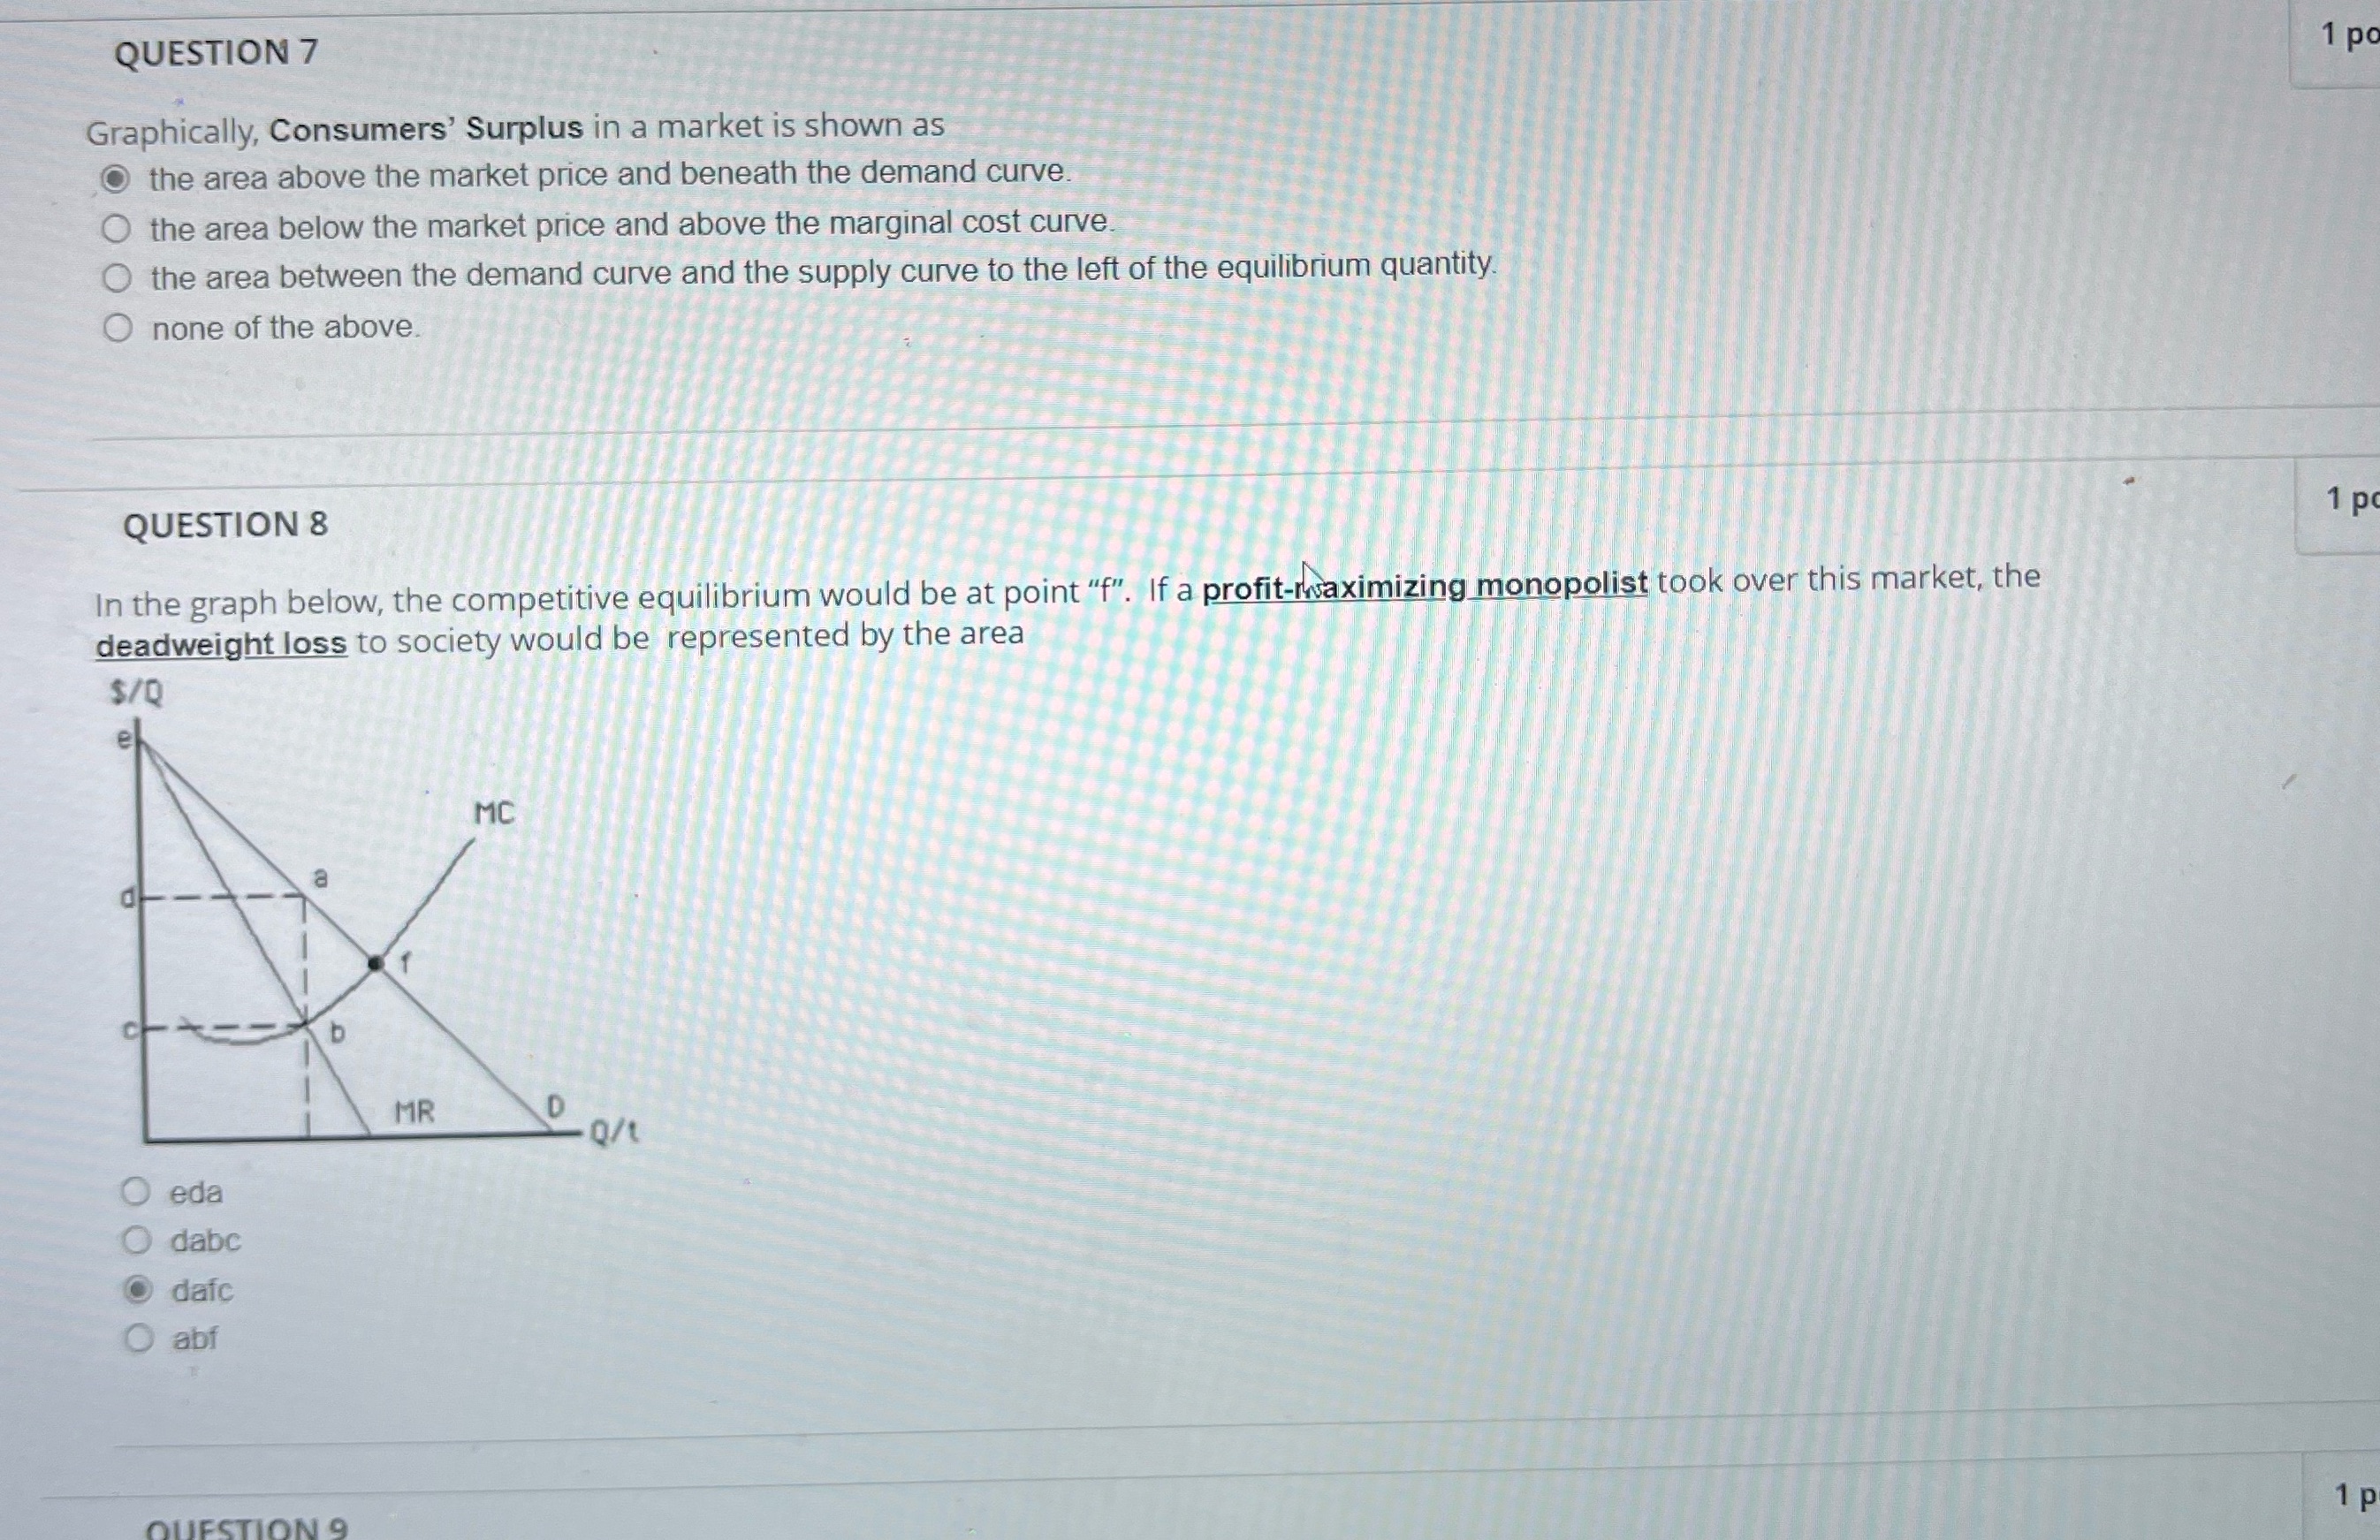
QUESTION 7 1 po Graphically, Consumers' Surplus in a market is shown as the area above the market price and beneath the demand curve. the area below the market price and above the marginal cost curve. the area between the demand curve and the supply curve to the left of the equilibrium quantity. none of the above. QUESTION 8 1 p In the graph below, the competitive equilibrium would be at point "f". If a profit-maximizing monopolist took over this market, the deadweight loss to society would be represented by the area $/Q MC MR D .0/t O eda O dabc dafc O abf QUESTION 9 1 p
Step by Step Solution
There are 3 Steps involved in it
1 Expert Approved Answer
Step: 1 Unlock

Question Has Been Solved by an Expert!
Get step-by-step solutions from verified subject matter experts
Step: 2 Unlock
Step: 3 Unlock