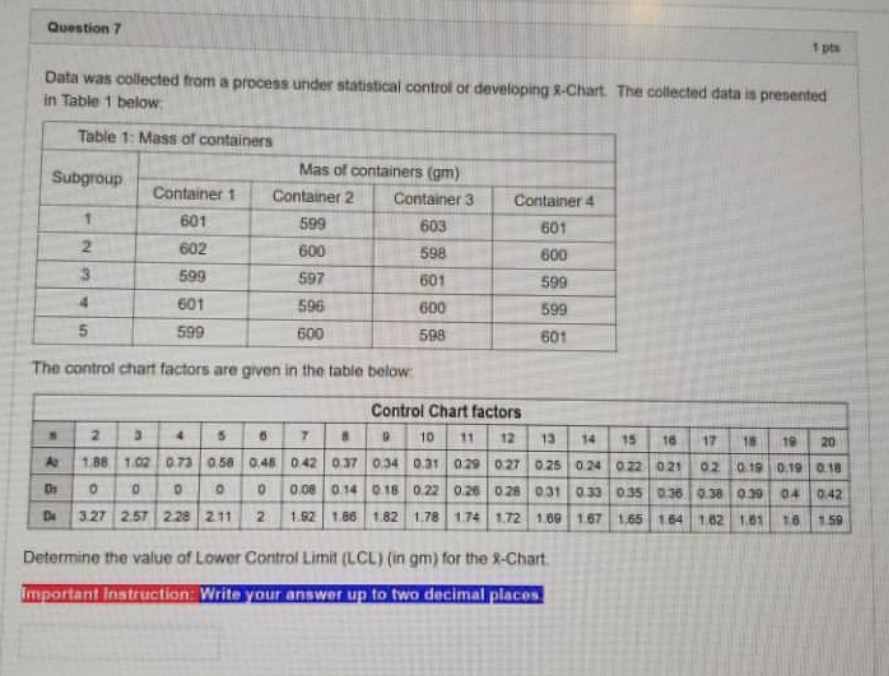
Question: Question 7 1 pts Data was collected from a process under statistical control or developing 8-Chart The collected data is presented in Table 1 below

Question 7 1 pts Data was collected from a

Question 7 1 pts Data was collected from a process under statistical control or developing 8-Chart The collected data is presented in Table 1 below Table 1: Mass of containers Mas of containers (gm) Subgroup Container 1 Container 2 Container 3 1 601 599 603 2. 602 600 598 3 599 597 601 601 596 600 5 599 600 598 Container 4 601 600 No 599 599 601 The control chart factors are given in the table below 4 17 - 28 & Control Chart factors 2 3 7 10 11 12 13 14 15 18 15 10 20 1.88 1.07 0.73058 0.46 0.42 0.37 0.34 0.31 0.29 0.27 0.25 0.24 022 021 02 0.19 0.19 0.18 0 0 0 O 0 0.08 0.14 0.18 0.22 0.26 0.28 0.31 0.33 0.350.36 0.300.39 04 0.42 3.27 2.57 228 211 2 1.92 1.861.82 1.78 174 1.72 1.09 167 165 164 182 1.61 1.6 59 De Determine the value of Lower Control Limit (LCL) (in gm) for the 8-Chart. Important instruction Write your answer up to two decimal places

Step by Step Solution

There are 3 Steps involved in it

1 Expert Approved Answer
Step: 1 Unlock blur-text-image
Question Has Been Solved by an Expert!

Get step-by-step solutions from verified subject matter experts

Step: 2 Unlock
Step: 3 Unlock

Students Have Also Explored These Related General Management Questions!