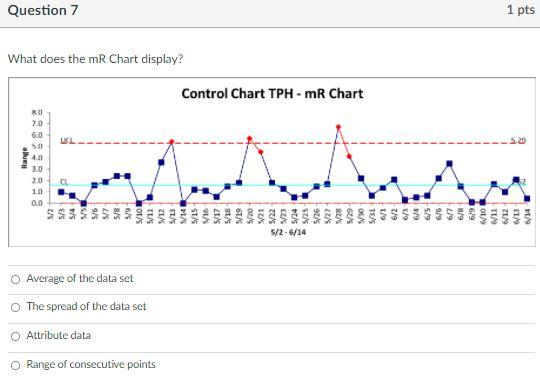
Question: Question 7 1 pts What does the mR Chart display? Control Chart TPH - MR Chart TAT 5.29 70 5.0 50 4.0 3.0 20 10

Question 7 1 pts What does the mR Chart display?

Question 7 1 pts What does the mR Chart display? Control Chart TPH - MR Chart TAT 5.29 70 5.0 50 4.0 3.0 20 10 0.0 CL . 553 5/6 8/5 6/5 5/10 5/11 512 S/13 VLAS St/S SV16 V18 5/19 520 W21 5/22 5/25 5726 5/27 928 -6/ OLAS ISS 6/1 6/2 1/9 6/6 6/5 6/6 16 8/9 01/9 6/11 6/12 6/13 6/14 5/26/14 Average of the data set The spread of the data set O Attribute data O Range of consecutive points

Step by Step Solution

There are 3 Steps involved in it

1 Expert Approved Answer
Step: 1 Unlock blur-text-image
Question Has Been Solved by an Expert!

Get step-by-step solutions from verified subject matter experts

Step: 2 Unlock
Step: 3 Unlock

Students Have Also Explored These Related General Management Questions!