

Question: Question 7: (10 points) The graph below, which uses Black-Scholes prices, describes the relation between time value of the EUROPEAN CALL option and the stock
Question 7: (10 points) The graph below, which uses Black-Scholes prices, describes the relation between time value of the EUROPEAN CALL option and the stock price. It assumes that: E = $60, T = 44 days, = 0.4, r = 6% (per year), and no dividends.
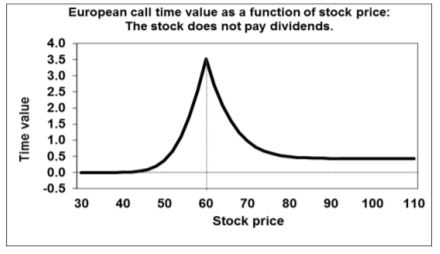
The at-the money option (with E=$60) has the highest time value.
a) Explain why the time value is falling more and more as we move from the stock price of $60 (which is equal to E) towards lower and lower stock prices. (3 points)
b) Explain why the time value is falling more and more as we move from the stock price of $60 (which is equal to E) towards higher and higher stock prices. (3 points)
c) Using the assumptions in this question, why is the time value of the European call option in this graph never negative? (2 points) d) When can the time value of a European call option on the stock become negative? (2 points)
Time value European call time value as a function of stock price: The stock does not pay dividends. 4.0 3.5 3.0 2.5 2.0 1.5 1.0 0.5 0.0 -0.5 30 40 50 60 70 80 90 100 110 Stock price
Step by Step Solution
There are 3 Steps involved in it

Get step-by-step solutions from verified subject matter experts