

Question: Consider the following table and Progress Report to answer the questions given below: Activity Predecessor Time(days) Estimated Cost A None IS 90 B None
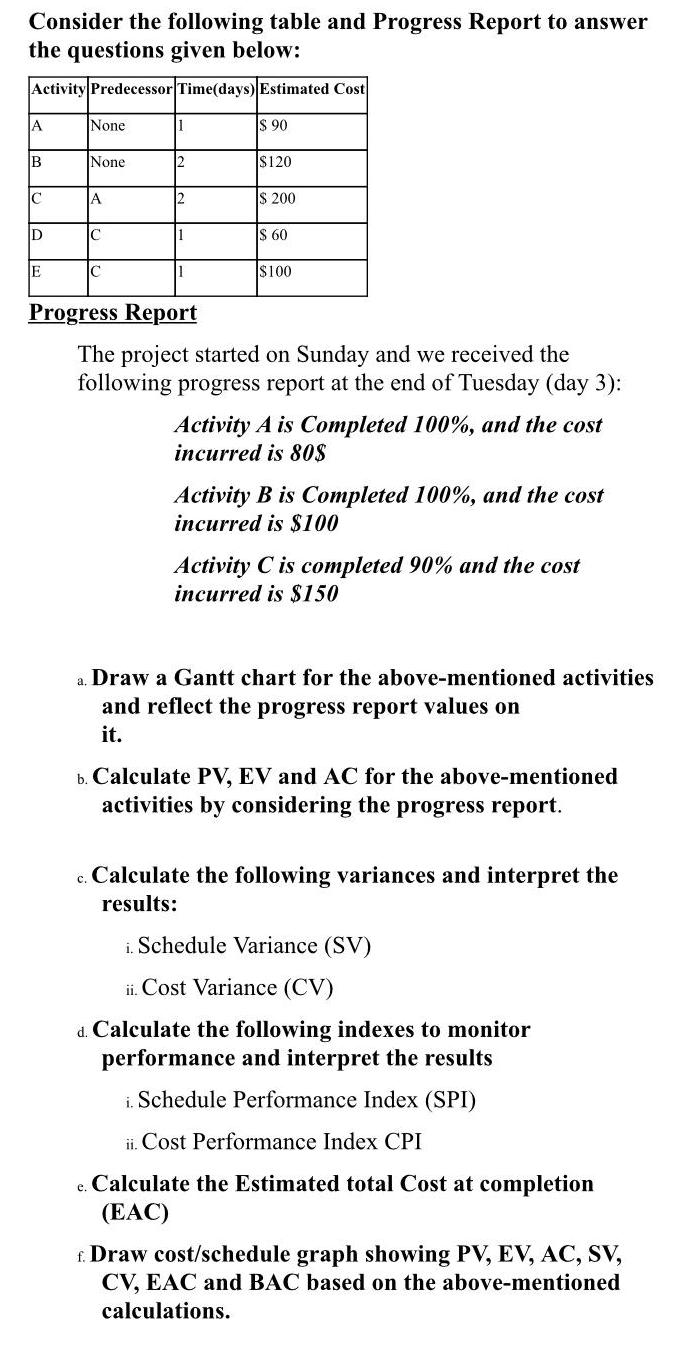
Consider the following table and Progress Report to answer the questions given below: Activity Predecessor Time(days) Estimated Cost A None IS 90 B None 2 $120 A S 200 ID IC 1 IS 60 E C $100 Progress Report The project started on Sunday and we received the following progress report at the end of Tuesday (day 3): Activity A is Completed 100%, and the cost incurred is 80S Activity B is Completed 100%, and the cost incurred is $100 Activity C is completed 90% and the cost incurred is $150 a. Draw a Gantt chart for the above-mentioned activities and reflect the progress report values on it. b. Calculate PV, EV and AC for the above-mentioned activities by considering the progress report. c. Calculate the following variances and interpret the results: i. Schedule Variance (SV) ii. Cost Variance (CV) d. Calculate the following indexes to monitor performance and interpret the results i. Schedule Performance Index (SPI) ii. Cost Performance Index CPI e. Calculate the Estimated total Cost at completion (EAC) f. Draw cost/schedule graph showing PV, EV, AC, SV, CV, EAC and BAC based on the above-mentioned calculations.
Step by Step Solution
3.38 Rating (151 Votes )
There are 3 Steps involved in it
a b Planned ValuePV Planned value is the approved value of the work to be completed in a given timeT... View full answer

Get step-by-step solutions from verified subject matter experts