

Question: QUESTION 7 math vs read 700 680 math 099 640 620 909 620 640 660 680 700 read The scatter diagram here is generated by:
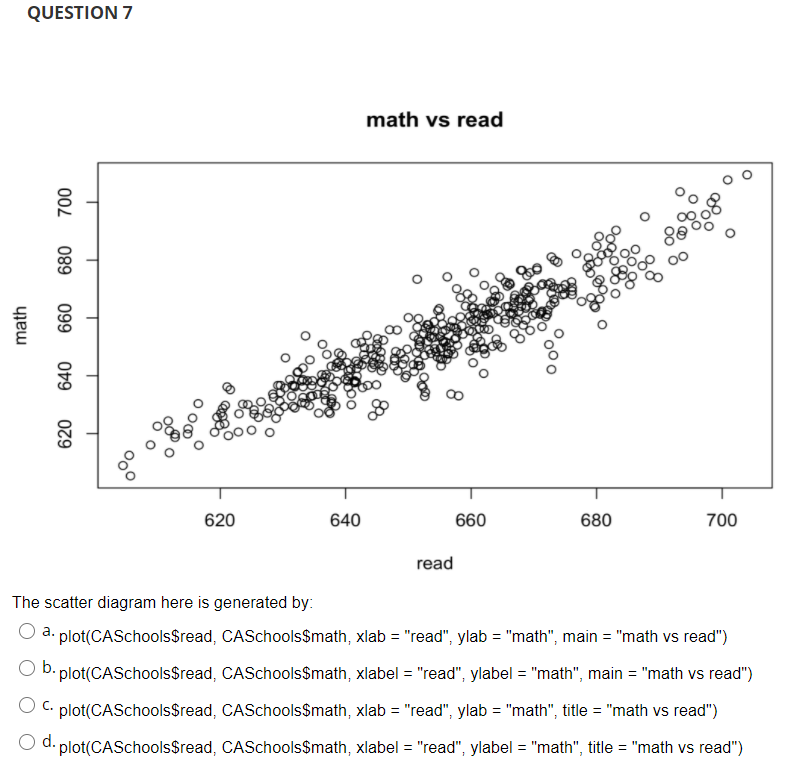
QUESTION 7 math vs read 700 680 math 099 640 620 909 620 640 660 680 700 read The scatter diagram here is generated by: a.plot(CASchools$read, CASchools$math, xlab = "read", ylab = "math", main = "math vs read") b.plot(CASchools$read, CASchools$math, xlabel = "read", ylabel = "math", main = "math vs read") . plot(CASchools$read, CASchools$math, xlab = "read", ylab = "math", title = "math vs read") O d.plot(CASchools$read, CASchools$math, xlabel = "read", ylabel = "math", title = "math vs read")
Step by Step Solution
There are 3 Steps involved in it
1 Expert Approved Answer
Step: 1 Unlock

Question Has Been Solved by an Expert!
Get step-by-step solutions from verified subject matter experts
Step: 2 Unlock
Step: 3 Unlock