

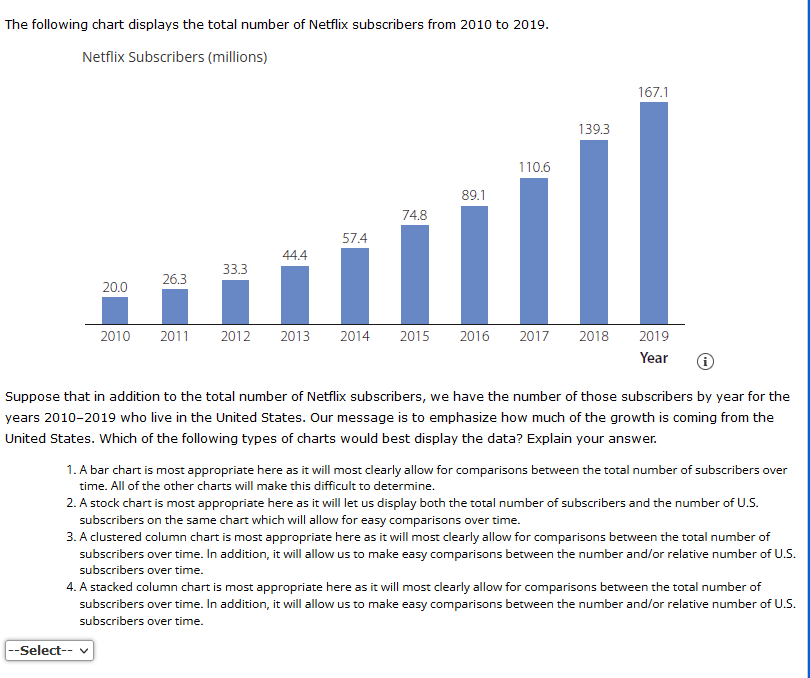
Question: Question 7 Question 8 Question 9 Question 10 Question 11 The following chart displays the total number of Netflix subscribers from 2010 to 2019 .
Question 7
Question 8
Question 9
Question 10
Question 11
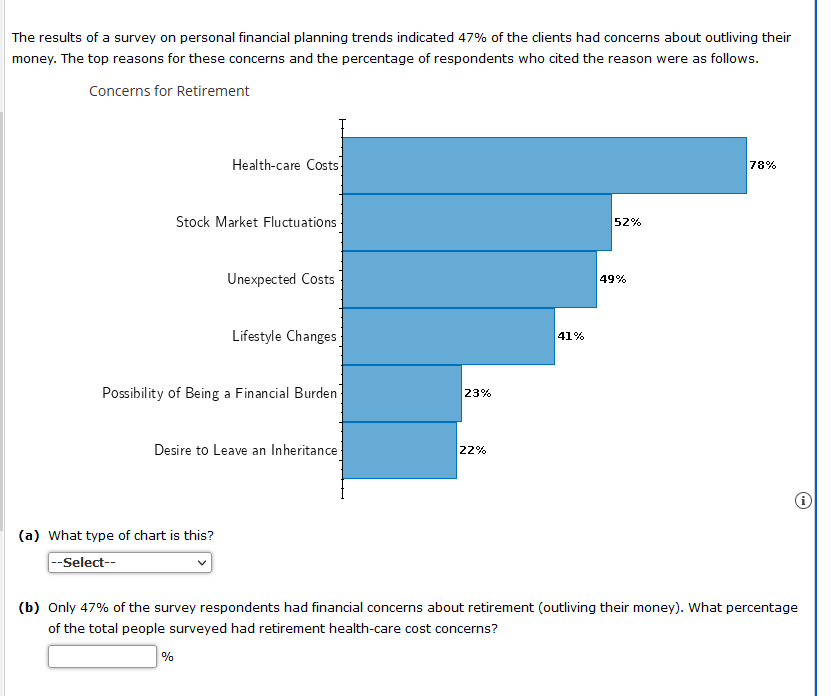
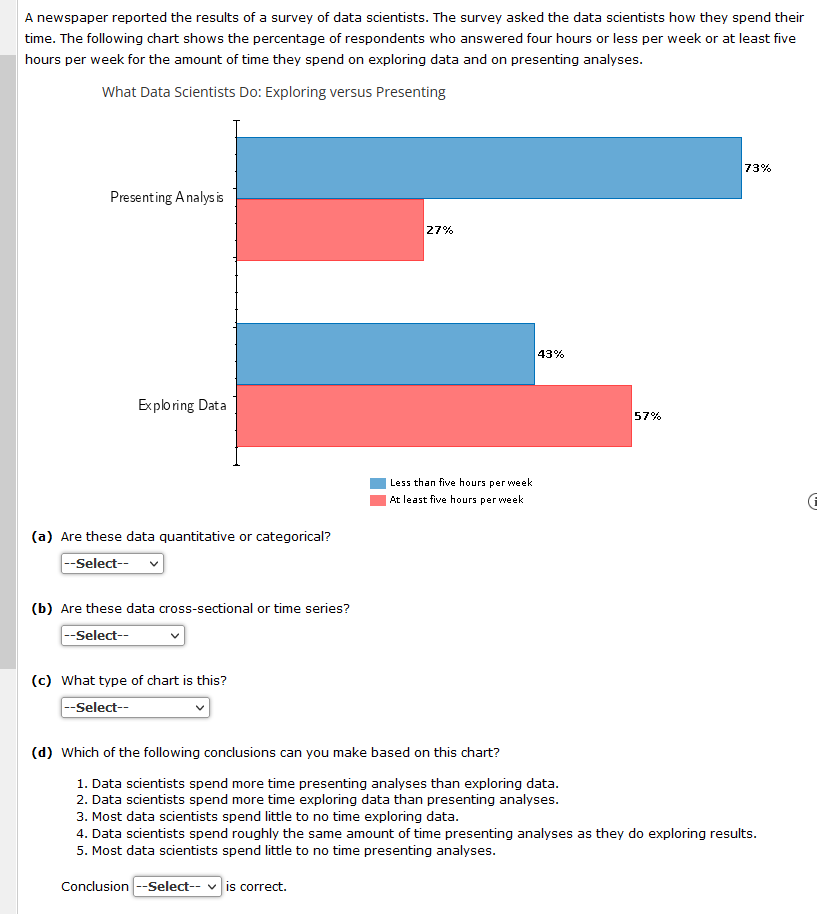
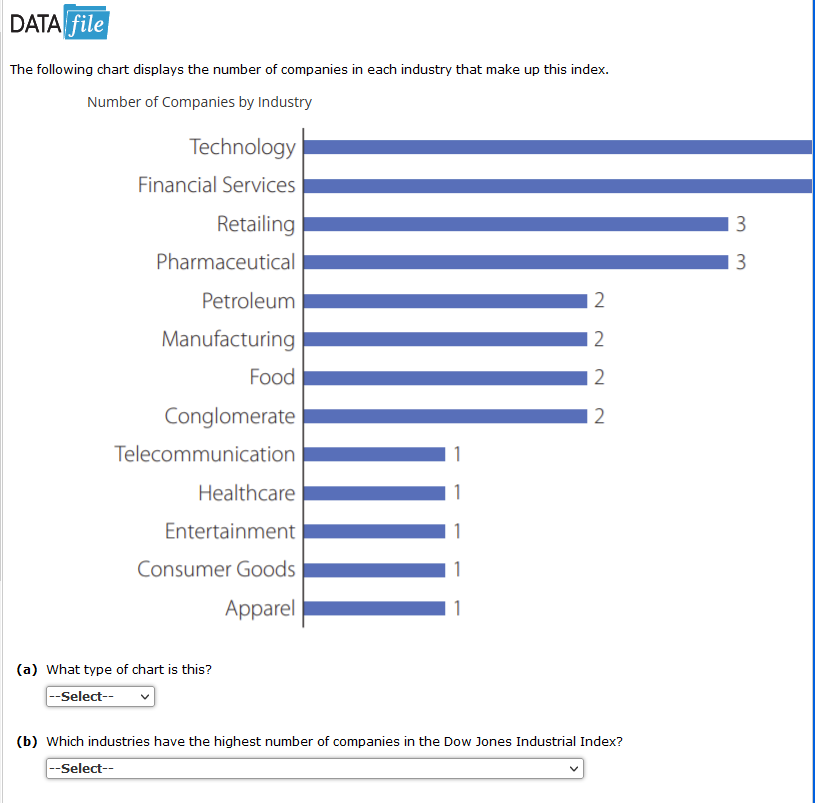
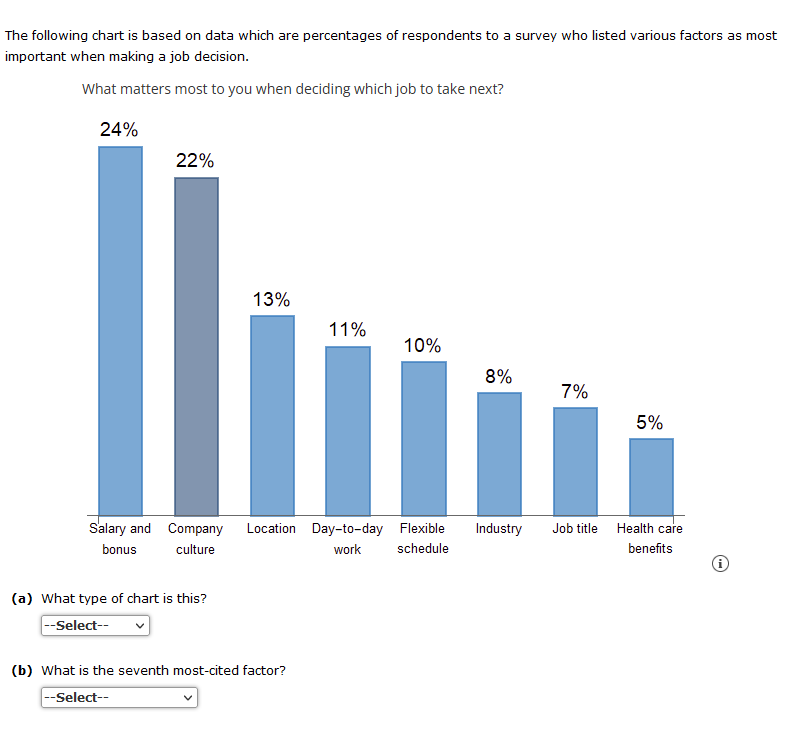
The following chart displays the total number of Netflix subscribers from 2010 to 2019 . Netflix Subscribers (millions) 167.1 Suppose that in addition to the total number of Netflix subscribers, we have the number of those subscribers by year for the years 2010-2019 who live in the United States. Our message is to emphasize how much of the growth is coming from the United States. Which of the following types of charts would best display the data? Explain your answer. 1. A bar chart is most appropriate here as it will most clearly allow for comparisons between the total number of subscribers over time. All of the other charts will make this difficult to determine. 2. A stock chart is most appropriate here as it will let us display both the total number of subscribers and the number of U.S. subscribers on the same chart which will allow for easy comparisons over time. 3. A clustered column chart is most appropriate here as it will most clearly allow for comparisons between the total number of subscribers over time. In addition, it will allow us to make easy comparisons between the number and/or relative number of U.S. subscribers over time. 4. A stacked column chart is most appropriate here as it will most clearly allow for comparisons between the total number of subscribers over time. In addition, it will allow us to make easy comparisons between the number and/or relative number of U.S. subscribers over time. A newspaper reported the results of a survey of data scientists. The survey asked the data scientists how they spend their time. The following chart shows the percentage of respondents who answered four hours or less per week or at least five hours per week for the amount of time they spend on exploring data and on presenting analyses. What Data Scientists Do: Exploring versus Presenting Presenting A nalys is 27% (a) Are these data quantitative or categorical? (b) Are these data cross-sectional or time series? (c) What type of chart is this? Less than five hours perweek At least five hours per week 43% 57% (d) Which of the following conclusions can you make based on this chart? 1. Data scientists spend more time presenting analyses than exploring data. 2. Data scientists spend more time exploring data than presenting analyses. 3. Most data scientists spend little to no time exploring data. 4. Data scientists spend roughly the same amount of time presenting analyses as they do exploring results. 5. Most data scientists spend little to no time presenting analyses. Conclusion is correct. The following chart displays the number of companies in each industry that make up this index. Number of Companies by Industry The following chart is based on data which are percentages of respondents to a survey who listed various factors as most important when making a job decision. What matters most to you when deciding which job to take next? The results of a survey on personal financial planning trends indicated 47% of the clients had concerns about outliving their money. The top reasons for these concerns and the percentage of respondents who cited the reason were as follows. Concerns for Retirement (a) What type of chart is this? (b) Only 47% of the survey respondents had financial concerns about retirement (outliving their money). What percentage of the total people surveyed had retirement health-care cost concerns? %
Step by Step Solution
There are 3 Steps involved in it

Get step-by-step solutions from verified subject matter experts