

Question: question 7 show work please du sales teams during the last quarter. Region A Region B Region Region D 8.3 13.6 8.6 5.9 19.6 3.9
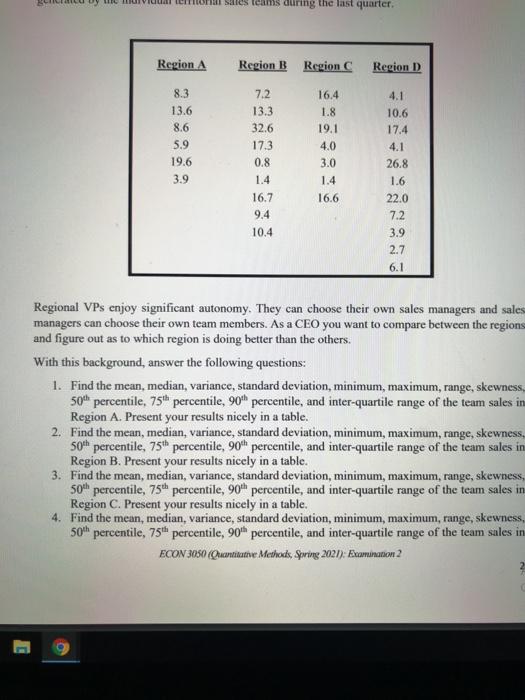
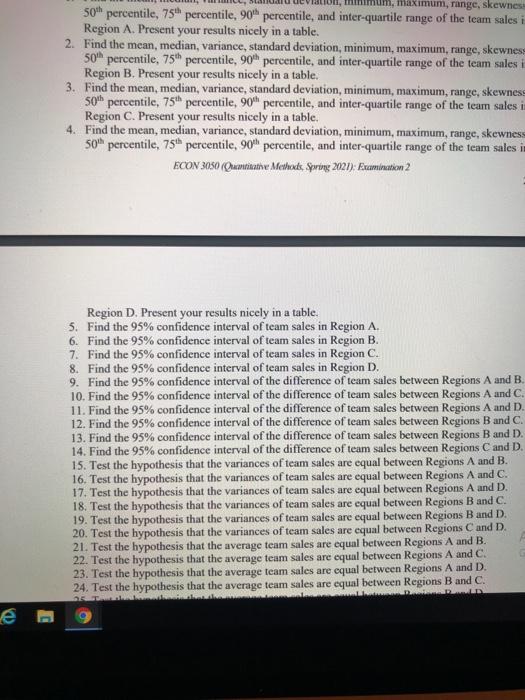
du sales teams during the last quarter. Region A Region B Region Region D 8.3 13.6 8.6 5.9 19.6 3.9 4.1 10.6 17.4 7.2 13.3 32.6 17.3 0.8 1.4 16.7 9.4 10.4 16.4 1.8 19.1 4.0 3.0 16.6 26.8 1.6 22.0 7.2 3.9 2.7 6.1 Regional VPs enjoy significant autonomy. They can choose their own sales managers and sales managers can choose their own team members. As a CEO you want to compare between the regions and figure out as to which region is doing better than the others. With this background, answer the following questions: 1. Find the mean, median, variance, standard deviation, minimum, maximum, range, skewness, 50 percentile, 75th percentile, 90 percentile, and inter-quartile range of the team sales in Region A. Present your results nicely in a table. 2. Find the mean, median, variance, standard deviation, minimum, maximum, range, skewness 50th percentile, 75 percentile, 90 percentile, and inter-quartile range of the team sales in Region B. Present your results nicely in a table. 3. Find the mean, median, variance, standard deviation, minimum, maximum, range, skewness, 50 percentile, 75 percentile, 90 percentile, and inter-quartile range of the team sales in Region C. Present your results nicely in a table. 4. Find the mean, median, variance, standard deviation, minimum, maximum, range, skewness 50 percentile, 75th percentile, 90 percentile, and inter-quartile range of the team sales in ECON 3050 (Quantitative Methods. Spring 2021). Ecomunatiom 2 2 maximum, range, skewness 50 percentile, 75 percentile, 90 percentile, and inter-quartile range of the team sales i Region A. Present your results nicely in a table. 2. Find the mean, median, variance, standard deviation, minimum, maximum, range, skewnes 50 percentile, 75h percentile, 90 percentile, and inter-quartile range of the team sales i Region B. Present your results nicely in a table. 3. Find the mean, median, variance, standard deviation, minimum, maximum, range, skewness 50 percentile, 75th percentile, 90 percentile, and inter-quartile range of the team sales in Region C. Present your results nicely in a table. 4. Find the mean, median, variance, standard deviation, minimum, maximum, range, skewness 50 percentile, 75 percentile, 90 percentile, and inter-quartile range of the team sales i ECON 3050 (Quantitative Methods, Spring 2012). Frummation 2 Region D. Present your results nicely in a table. 5. Find the 95% confidence interval of team sales in Region A. 6. Find the 95% confidence interval of team sales in Region B. 7. Find the 95% confidence interval of team sales in Region C. 8. Find the 95% confidence interval of team sales in Region D. 9. Find the 95% confidence interval of the difference of team sales between Regions A and B. 10. Find the 95% confidence interval of the difference of team sales between Regions A and C. 11. Find the 95% confidence interval of the difference of team sales between Regions A and D. 12. Find the 95% confidence interval of the difference of team sales between Regions B and C. 13. Find the 95% confidence interval of the difference of team sales between Regions B and D. 14. Find the 95% confidence interval of the difference of team sales between Regions and D. 15. Test the hypothesis that the variances of team sales are equal between Regions A and B. 16. Test the hypothesis that the variances of team sales are equal between Regions A and C. 17. Test the hypothesis that the variances of team sales are equal between Regions A and D. 18. Test the hypothesis that the variances of team sales are equal between Regions B and C. 19. Test the hypothesis that the variances of team sales are equal between Regions B and D. 20. Test the hypothesis that the variances of team sales are equal between Regions and D. 21. Test the hypothesis that the average team sales are equal between Regions A and B. 22. Test the hypothesis that the average team sales are equal between Regions A and C. 23. Test the hypothesis that the average team sales are equal between Regions A and D. 24. Test the hypothesis that the average team sales are equal between Regions B and C. (0)
Step by Step Solution
There are 3 Steps involved in it

Get step-by-step solutions from verified subject matter experts