

Question: Question 8 12 pts Using the Supply and Demand data below, graph the equilibrium price and quantity for the market for oats. Identify the equilibrium
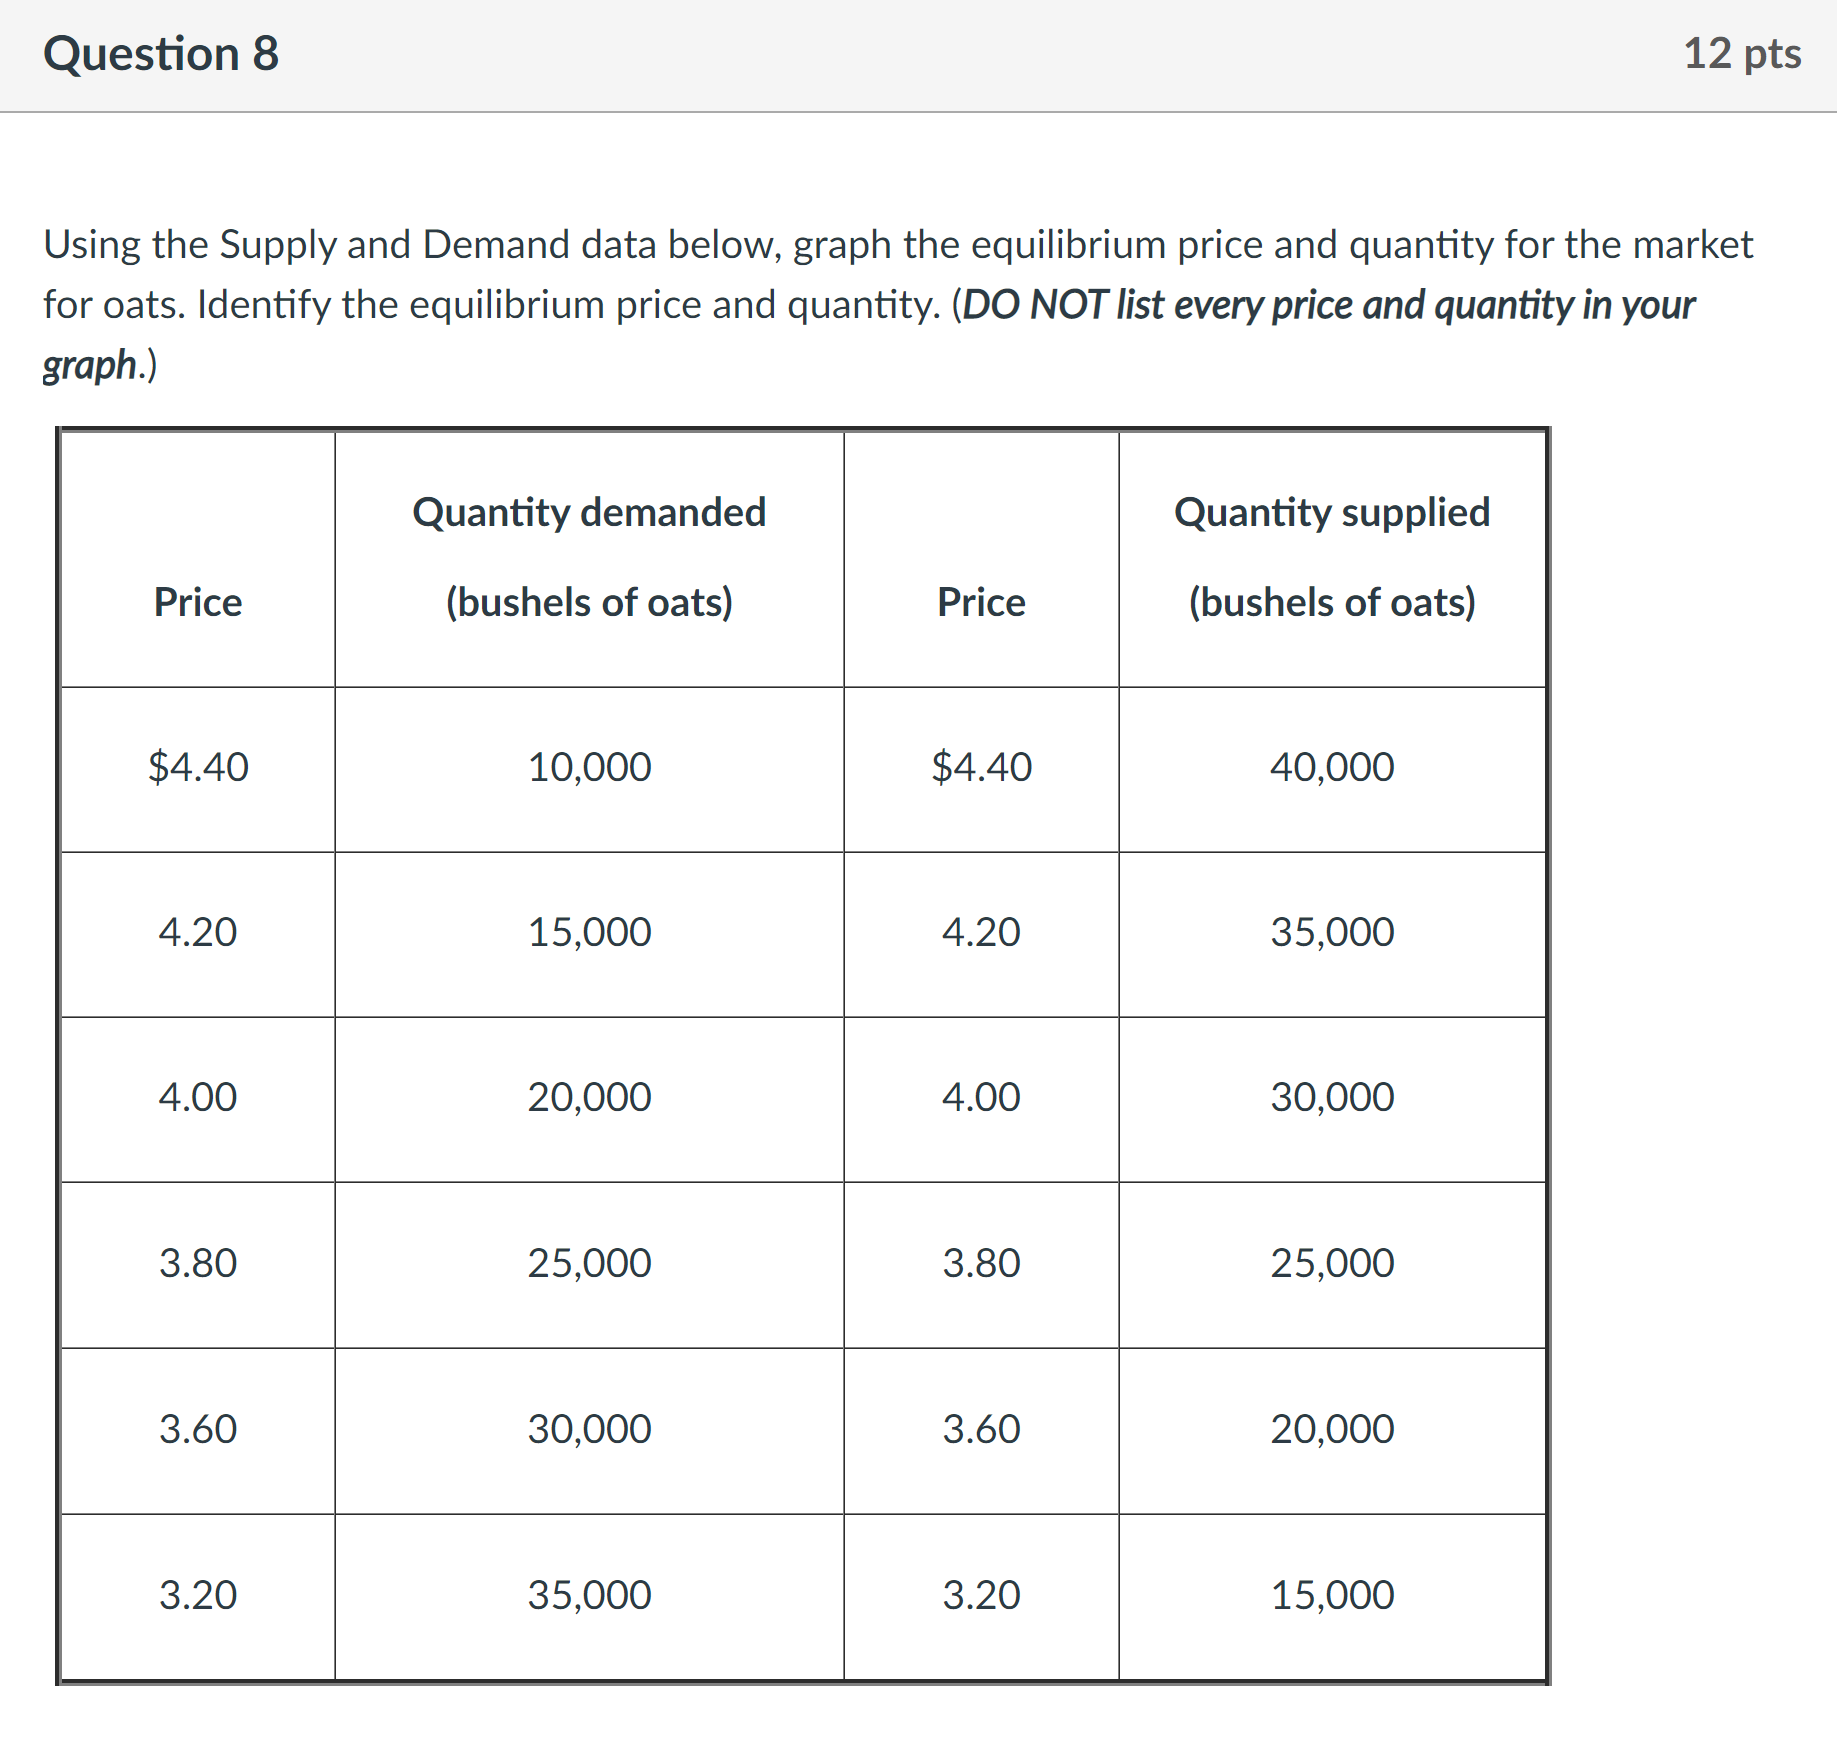
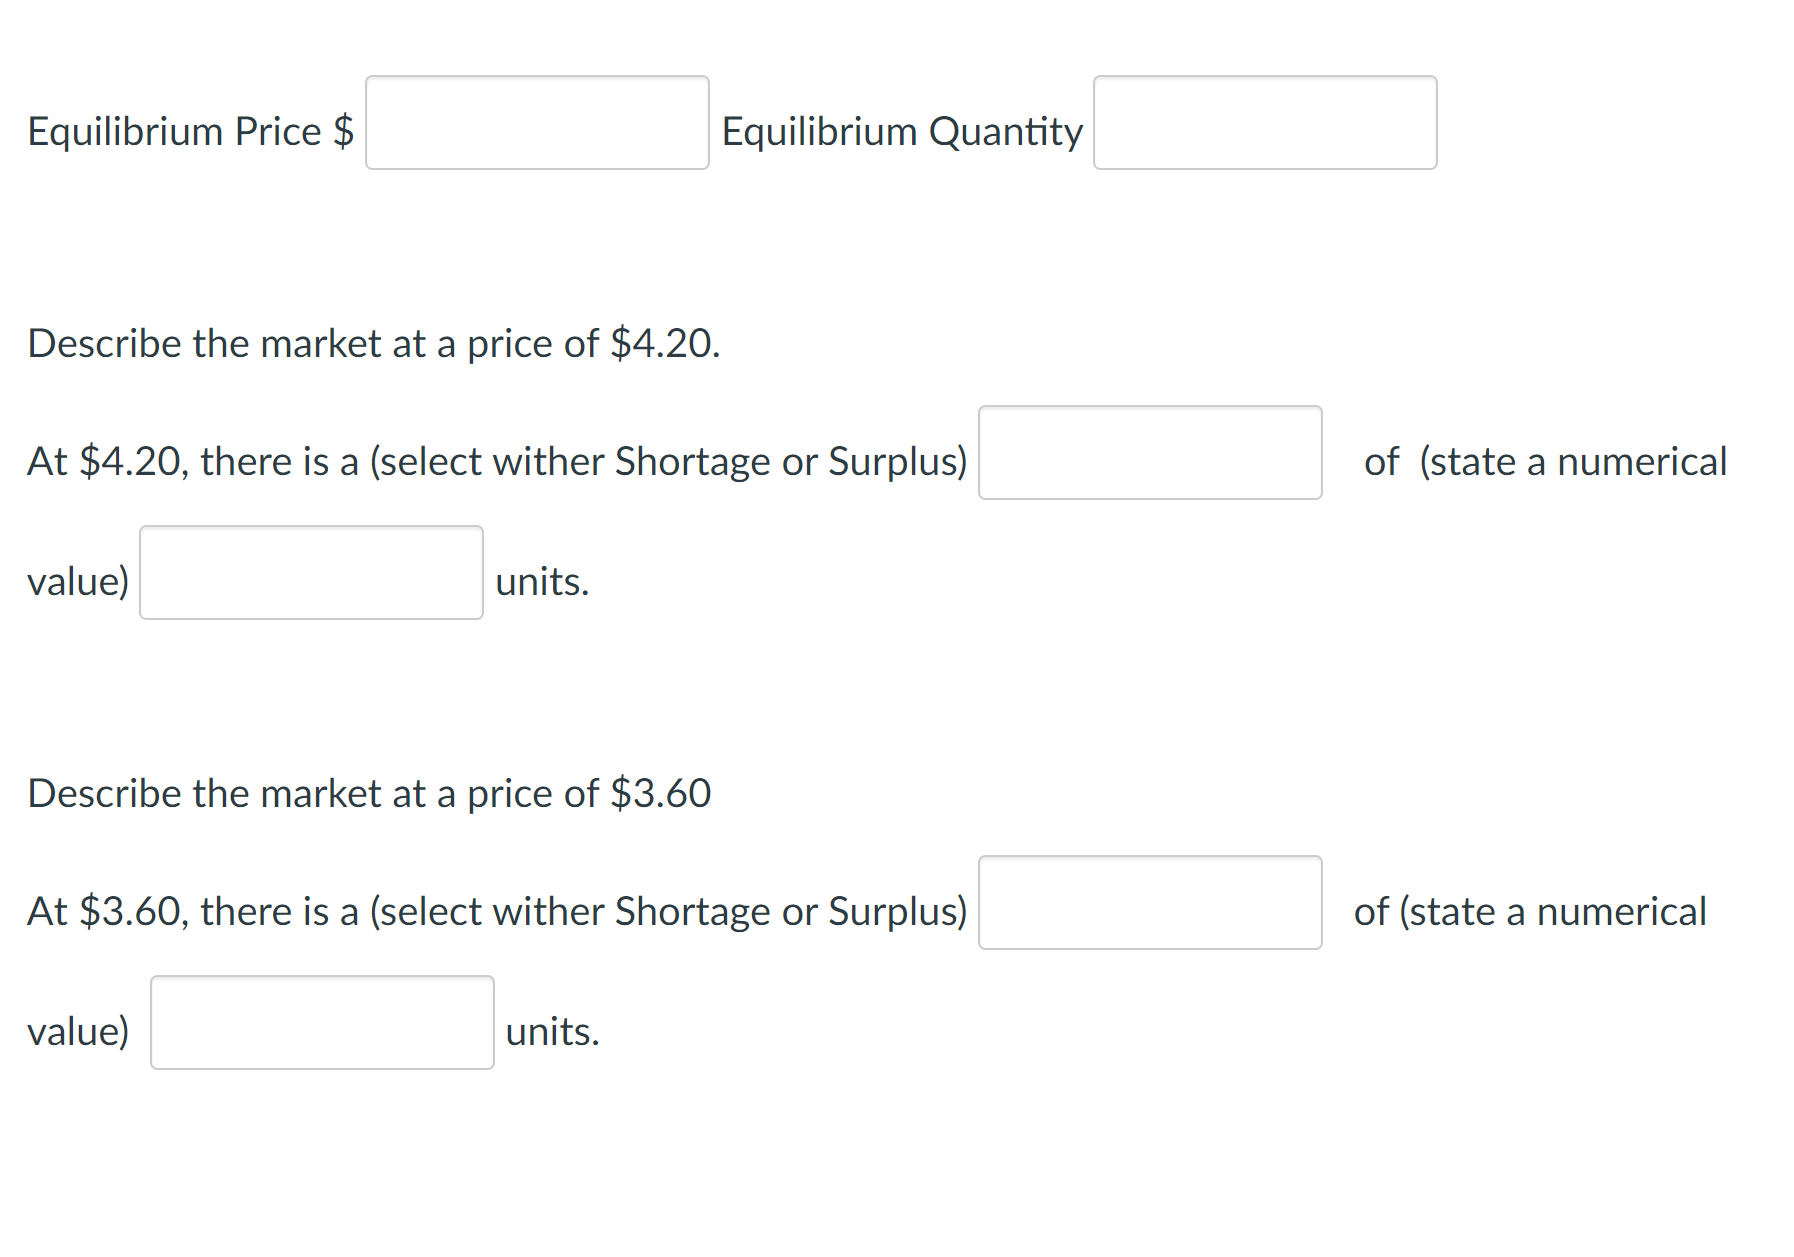
Question 8 12 pts Using the Supply and Demand data below, graph the equilibrium price and quantity for the market for oats. Identify the equilibrium price and quantity. (DO NOTlist every price and quantity in your graph.) Quantity demanded (bushels of oats) Quantity supplied (bushels of oats) Equilibrium Price $ Equilibrium Quantity Describe the market at a price of $4.20. At $4.20, there is a (select wither Shortage or Surplus) of (state a numerical value) units. Describe the market at a price of $3.60 At $3.60, there is a (select wither Shortage or Surplus) of (state a numerical value) units
Step by Step Solution
There are 3 Steps involved in it
1 Expert Approved Answer
Step: 1 Unlock

Question Has Been Solved by an Expert!
Get step-by-step solutions from verified subject matter experts
Step: 2 Unlock
Step: 3 Unlock