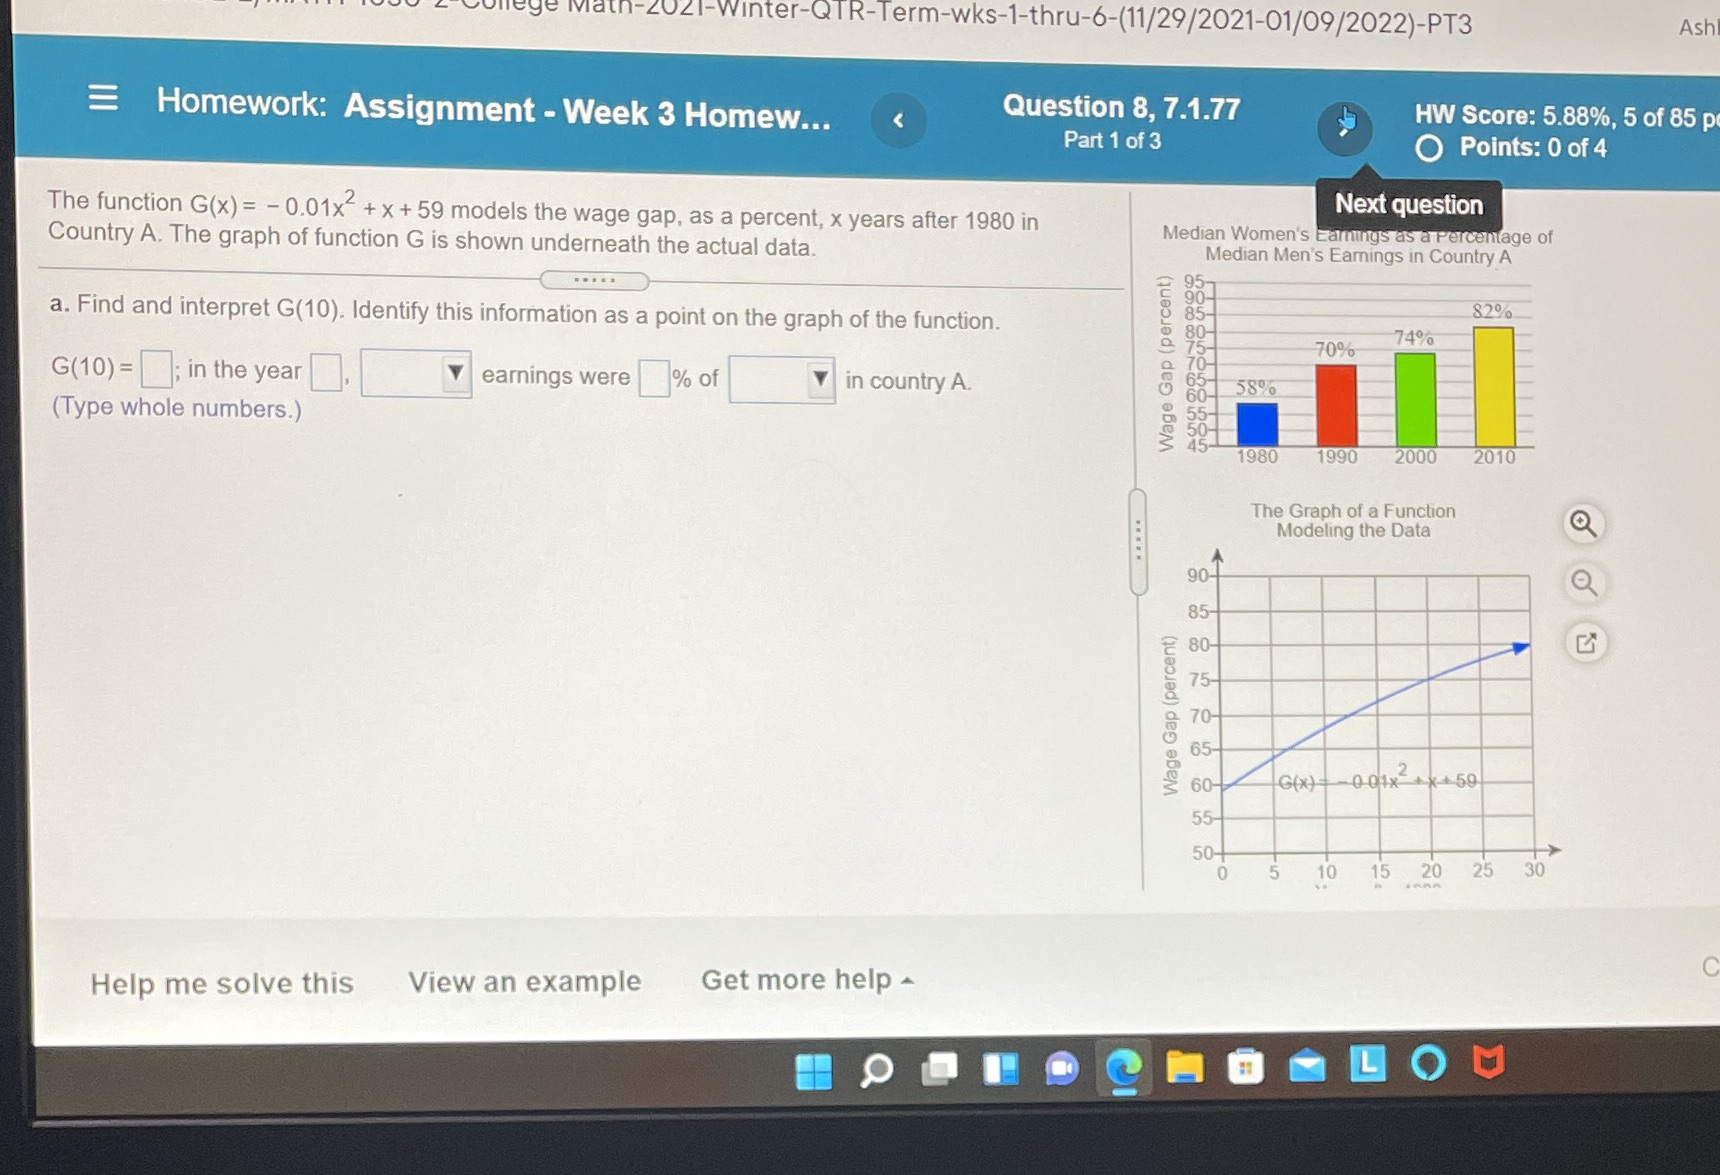
Question: = . - Question 8 7.1.77 Hw Score: 5.88% 5 of 85 p- _ o . . . . H mework Assrgnment Week 3 Homew...

= . - Question 8 7.1.77 Hw Score: 5.88% 5 of 85
= . - Question 8 7.1.77 Hw Score: 5.88% 5 of 85 p- _ o . . . . H mework Assrgnment Week 3 Homew... Par\" 0,3 0 Points: 0 0\" The function G(x) = - 0.01):2 + x + 59 models the wage gap, as a percent, x years after 1980 in Next question Country A. The graph of function G is shown underneath the actual data. 3. Find and interpret (3(10). Identify this information as a point on the graph of the iunction. E 35 E 7 (3(10) = D; in the year D Y earnings were E% of . Y5 in country A. 8 5 (Type whole numbers.) 9 2 , 3 4 1930 1990 The Graph 01 a Function ' e; . Modeling the Data E l g 3 E (D 4) . E E Help me solve this View an example Get more help

Step by Step Solution

There are 3 Steps involved in it

1 Expert Approved Answer
Step: 1 Unlock blur-text-image
Question Has Been Solved by an Expert!

Get step-by-step solutions from verified subject matter experts

Step: 2 Unlock
Step: 3 Unlock

Students Have Also Explored These Related Mathematics Questions!