

Question: question 8 a thru g pleaseee 8. The following data were obtained in calibrating a calcium ion electrode for the determination of pCa. (Note: pCa=
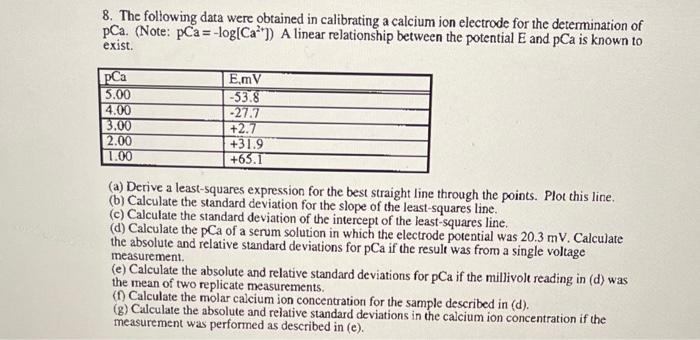
8. The following data were obtained in calibrating a calcium ion electrode for the determination of pCa. (Note: pCa= -log(Ca**]) A linear relationship between the potential and pCa is known to exist. pCa 5.00 4.00 3.00 2.00 1.00 E.mv -53.8 -27.7 +2.7 +31.9 +63.1 (a) Derive a least-squares expression for the best straight line through the points. Plot this line. (b) Calculate the standard deviation for the slope of the least-squares line. (c) Calculate the standard deviation of the intercept of the least-squares line. (d) Calculate the pCa of a serum solution in which the electrode potential was 20.3 mV. Calculate the absolute and relative standard deviations for pCa if the result was from a single voltage measurement (e) Calculate the absolute and relative standard deviations for pCa if the millivolt reading in (d) was the mean of two replicate measurements. (f) Calculate the molar calcium ion concentration for the sample described in (d). (8) Calculate the absolute and relative standard deviations in the calcium ion concentration if the measurement was performed as described in (e)
Step by Step Solution
There are 3 Steps involved in it

Get step-by-step solutions from verified subject matter experts