

Question: Question 8: (from chapter 12) The following table shows data on average per capita wine consumption and heart disease rate in a random sample of
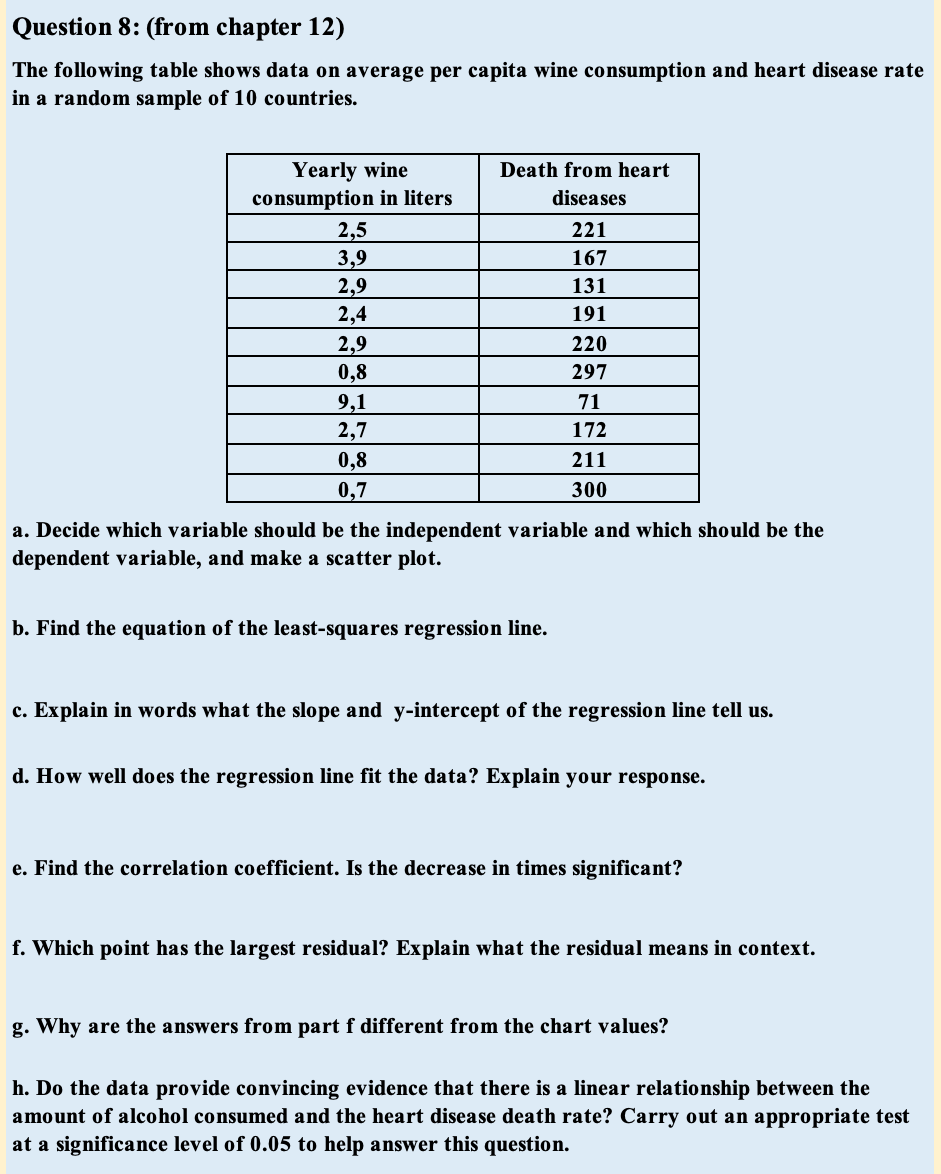

Question 8: (from chapter 12) The following table shows data on average per capita wine consumption and heart disease rate in a random sample of 10 countries. Yearly wine Death from heart consumption in liters diseases 2,5 221 3,9 167 2,9 131 2,4 191 2,9 220 0,8 297 9,1 71 2,7 172 0,8 211 0,7 300 a. Decide which variable should be the independent variable and which should be the dependent variable, and make a scatter plot. b. Find the equation of the least-squares regression line. c. Explain in words what the slope and y-intercept of the regression line tell us. d. How well does the regression line fit the data? Explain your response. e. Find the correlation coefficient. Is the decrease in times significant? f. Which point has the largest residual? Explain what the residual means in context. g. Why are the answers from part f different from the chart values? h. Do the data provide convincing evidence that there is a linear relationship between the amount of alcohol consumed and the heart disease death rate? Carry out an appropriate test at a significance level of 0.05 to help answer this
Step by Step Solution
There are 3 Steps involved in it

Get step-by-step solutions from verified subject matter experts