

Question: Share View Insert Format Tools Add-ons Help Accessibility Last edit was seconds ago 100% CHO. = = = = EX E . FEEN =. .
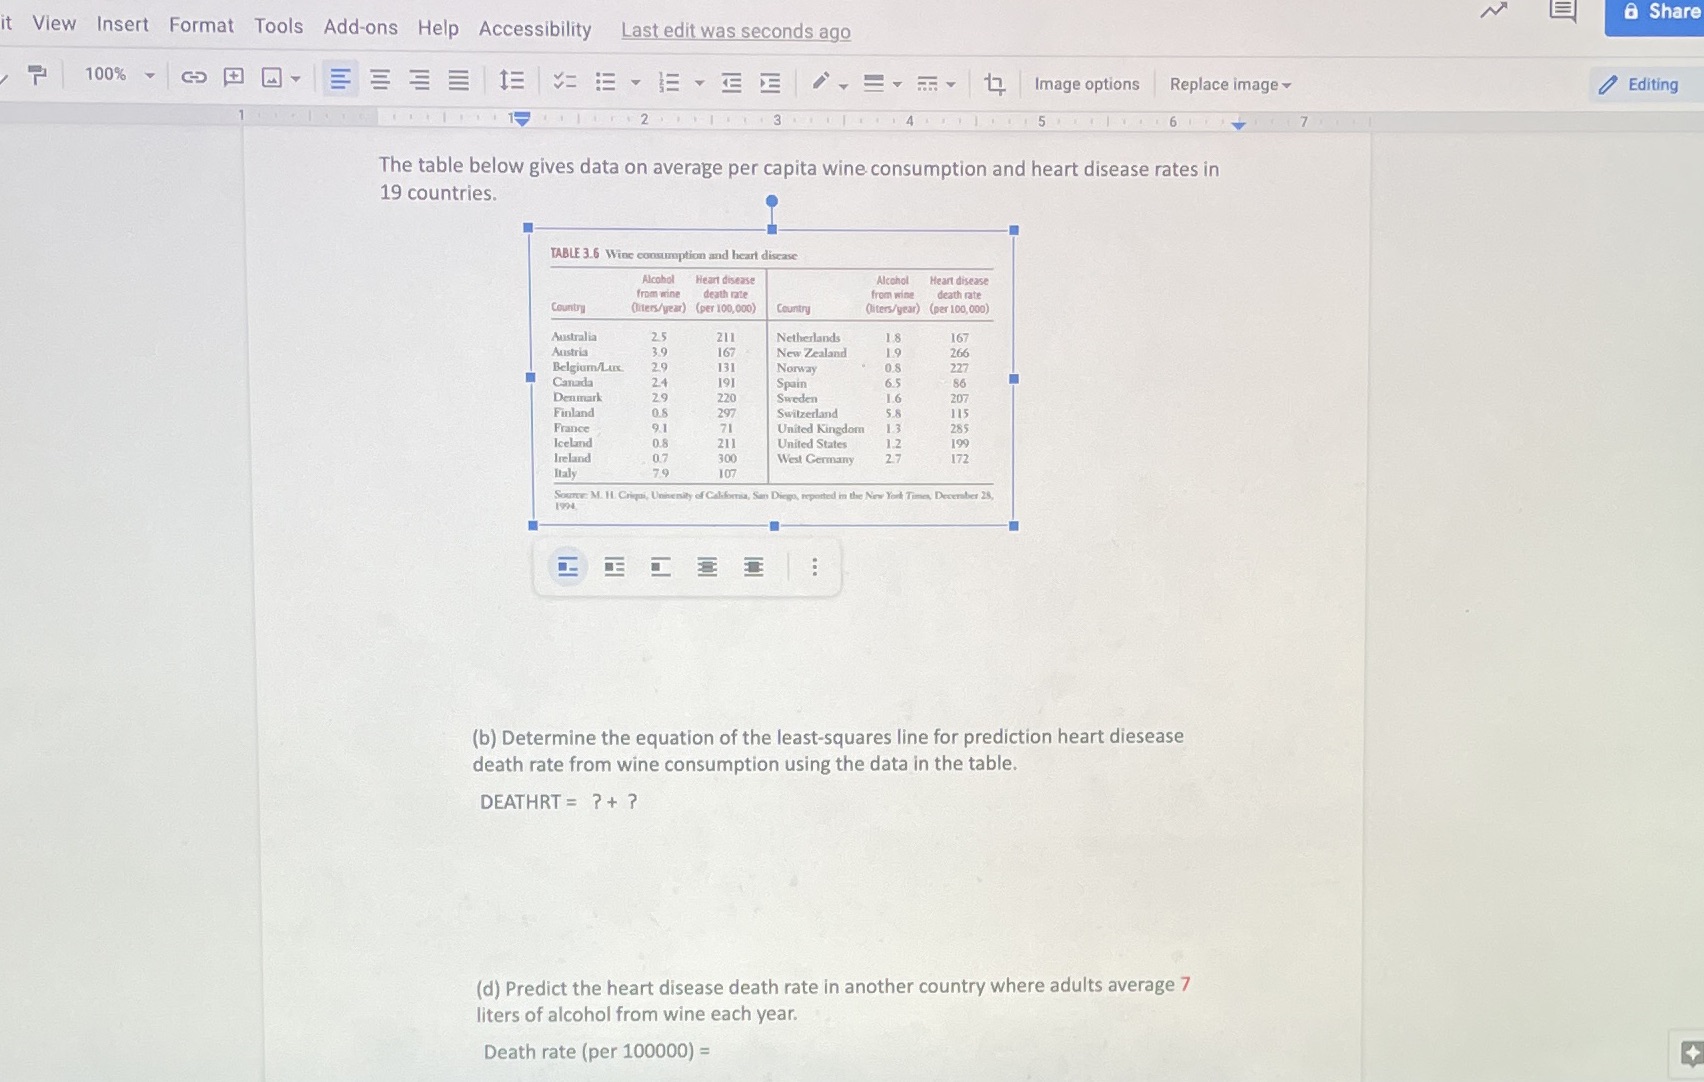
Share View Insert Format Tools Add-ons Help Accessibility Last edit was seconds ago 100% CHO. = = = = EX E . FEEN =. . 1 Image options Replace image - Editing 7 The table below gives data on average per capita wine consumption and heart disease rates in 19 countries. TABLE 3.6 Wine consumption and heart disease Alcohol Heart disease Alcohol Heart disease from wine death rate from wine death rate country (Jiters/year) (per 100,000) Country (liters/year) (per 100,000) Australia 25 211 Netherlands 1.8 167 Austria 39 167 New Zealand 19 266 Belgium/Lux. 29 131 Norway 227 Canada 24 191 Spain 65 86 Denmark 29 220 Sweden 16 207 Finland 297 Switzerland 5.8 115 France 91 71 United Kingdom 13 285 Iceland 0.8 211 United States 12 199 Ireland 07 300 West Germany 27 172 Italy 107 Source: M. IL Criqui, University ported in the New York Times, Deceraber 28 (b) Determine the equation of the least-squares line for prediction heart diesease death rate from wine consumption using the data in the table. DEATHRT = ?+ ? (d) Predict the heart disease death rate in another country where adults average 7 liters of alcohol from wine each year. Death rate (per 100000) =
Step by Step Solution
There are 3 Steps involved in it

Get step-by-step solutions from verified subject matter experts