

Question: Question 8 Points 3 Study the graph below, and answer the question which follows. 8% 7% (A) 6% (B) 5% 4% 3% (C) A
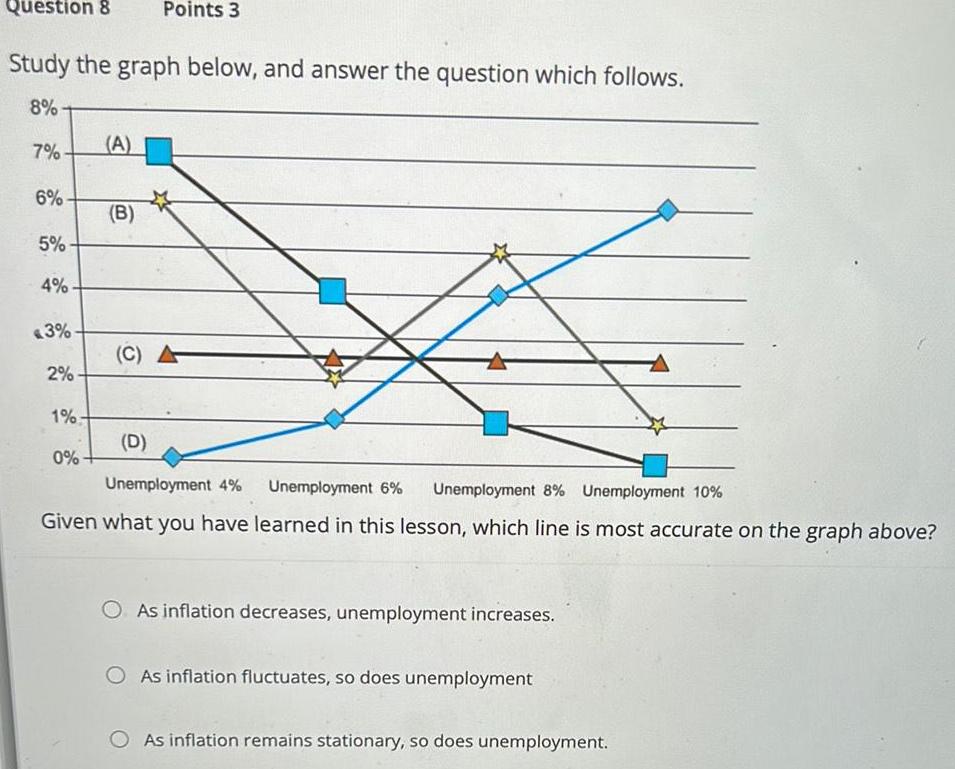
Question 8 Points 3 Study the graph below, and answer the question which follows. 8% 7% (A) 6% (B) 5% 4% 3% (C) A 2% 1%- (D) 0% Unemployment 4% Unemployment 6% Unemployment 8% Unemployment 10% Given what you have learned in this lesson, which line is most accurate on the graph above? As inflation decreases, unemployment increases. O As inflation fluctuates, so does unemployment O As inflation remains stationary, so does unemployment.
Step by Step Solution
There are 3 Steps involved in it
1 Expert Approved Answer
Step: 1 Unlock

Question Has Been Solved by an Expert!
Get step-by-step solutions from verified subject matter experts
Step: 2 Unlock
Step: 3 Unlock