Question: Question 8 Question 8 Gasoline Blending Model Gasoline Inputs Octane Rating Regular Supreme Used Available Cost Input 1 150 0 150.0 150 $17.25 100 The

Question 8Question 8 Question 8 Gasoline Blending Model

Question 8 Gasoline Blending Model Gasoline Inputs Octane Rating Regular Supreme Used Available Cost Input 1 150 0 150.0 150 $17.25 100 The LP model shown on the worksheet for Question 8 represents the gasoline blending problem discussed in class. The problem is to determe how much of each input to use in making each gasoline output (regular gas and supreme gas) in order to maximize profit. There are constraints involving input availability, quantity of output to produce, and octane ratings. Input 2 96 254 350.0 350 $15.75 87 Input 3 54 196 250.0 300 $17.75 110 Total Produced 300 450 Required Quantity 300 450 Revenue/Barrel $21.00 $25.00 Create a Spider Table and Spider Chart showing how profit changes when the quantities of the 3 inputs vary from 90% of their current availability to 110% of their current availability. You only need to consider three axis points: minimum, base, and maximum. Octane Requirements Income Statement Req'd Octane Rating 90 97 Revenue 17,550.00 Actual Octane Rating 98 97 Cost 12,537.50 Octane Constraint RHS 27,000 43,650 Profit 5,012.50 Octane Constraint LHS 29,300 43,650 You can create the table with Analytic Solver or create it manually (it's easy because the table will have only 3 rows). Based on this analysis, which input has the largest impact on profit when it's varied from its base value

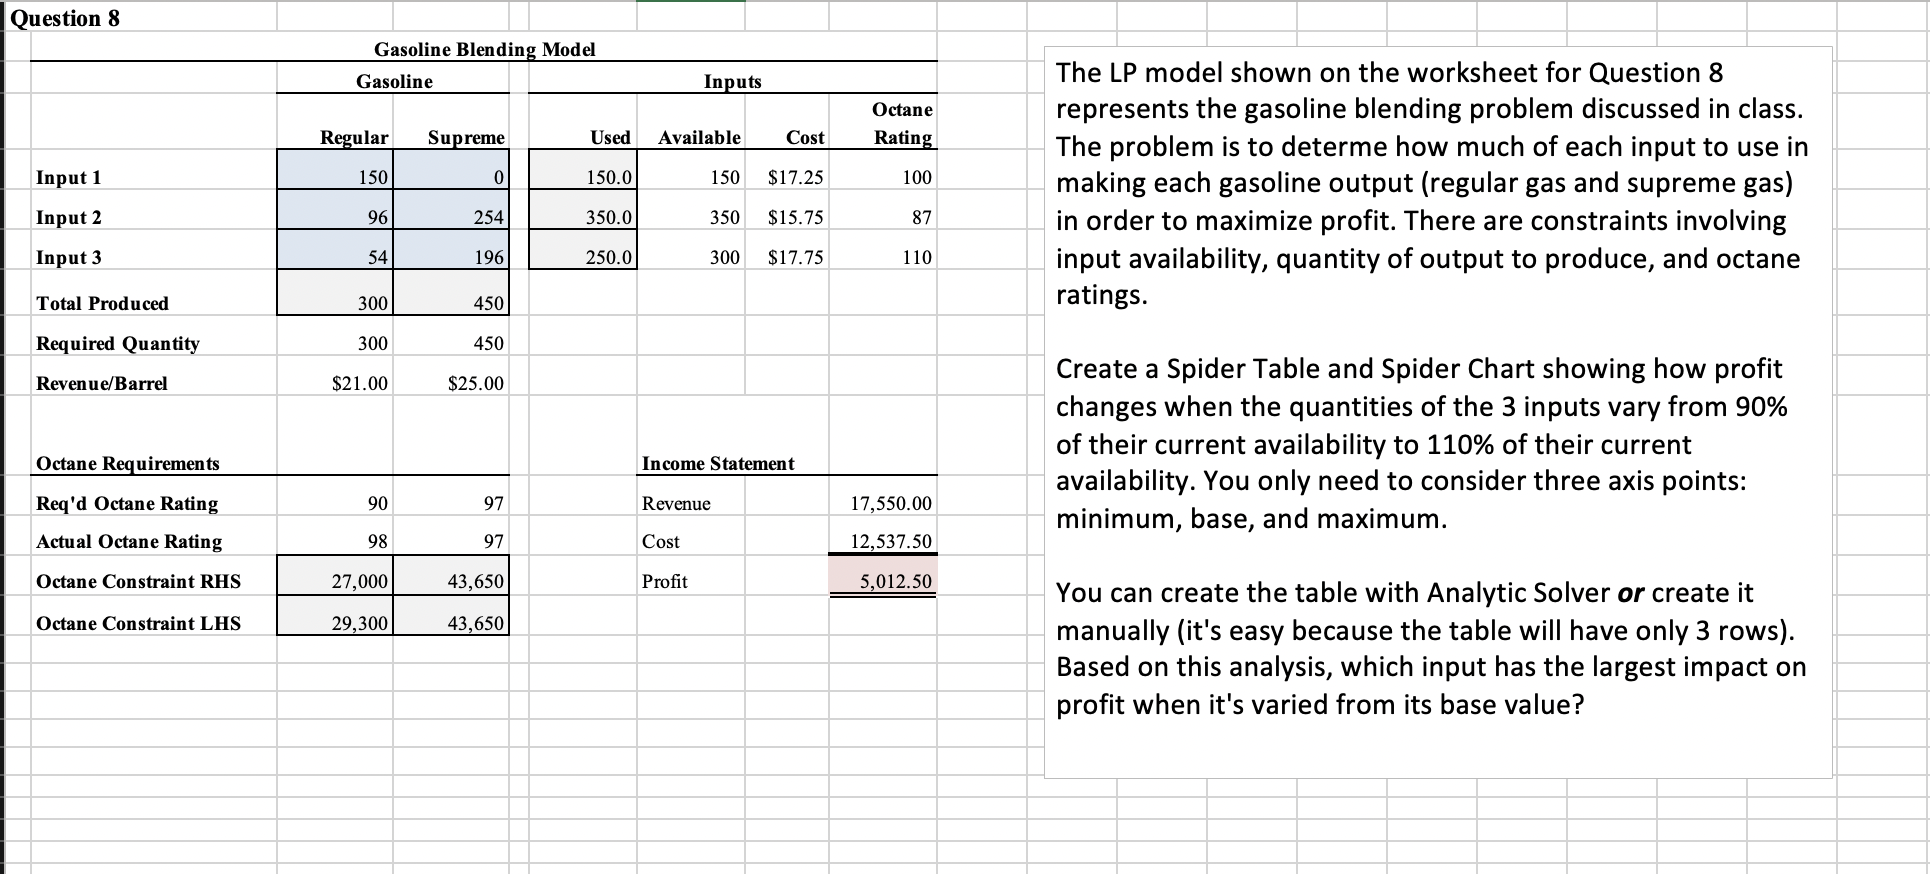
Step by Step Solution

There are 3 Steps involved in it

1 Expert Approved Answer
Step: 1 Unlock blur-text-image
Question Has Been Solved by an Expert!

Get step-by-step solutions from verified subject matter experts

Step: 2 Unlock
Step: 3 Unlock

Students Have Also Explored These Related General Management Questions!