

Question: QUESTION 8 Table 3 presents historical returns from three different assets - X , Y , and Z - from 2 0 1 7 to
QUESTION
Table presents historical returns from three different assets X Y and Z from to
along with their average returns and standard deviations.
Required:
a Compute and interpret the following:
iAverage returns on assets and
iiStandard deviation or the risks of assets and
iii.Portfolio returns for and ivPortfolio
standard deviation for and
b Describe the relationship among the assets. What happens when these assets are
combined in different ways to form portfolios?QUESTION
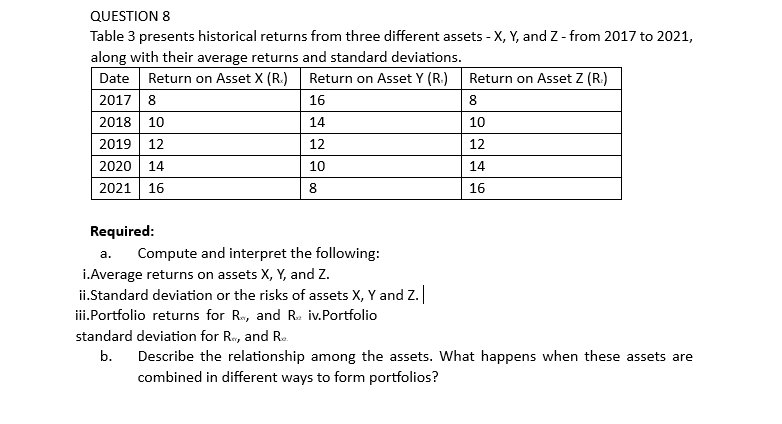
Table presents historical returns from three different assets X Y and Z from to along with their average returns and standard deviations.
Date Return on Asset X RX Return on Asset Y RY Return on Asset Z RZ
Required:
a Compute and interpret the following:
iAverage returns on assets X Y and Z
iiStandard deviation or the risks of assets X Y and Z
iii.Portfolio returns for RXY and RXZ ivPortfolio standard deviation for RXY and RXZ
b Describe the relationship among the assets. What happens when these assets are combined in different ways to form portfolios?
Step by Step Solution
There are 3 Steps involved in it
1 Expert Approved Answer
Step: 1 Unlock

Question Has Been Solved by an Expert!
Get step-by-step solutions from verified subject matter experts
Step: 2 Unlock
Step: 3 Unlock