

Question: Question 9 (2.5 points) Saved The easiest function in Excel to provide the measure of variation explained by the estimated line based on the
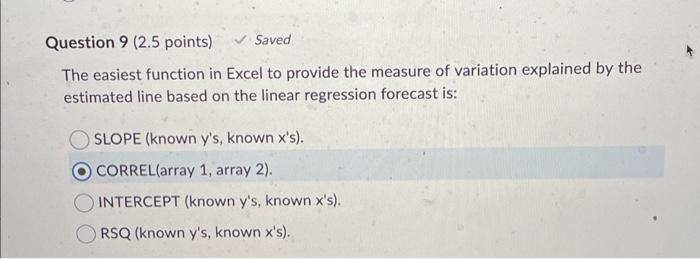
Question 9 (2.5 points) Saved The easiest function in Excel to provide the measure of variation explained by the estimated line based on the linear regression forecast is: SLOPE (known y's, known x's). CORREL(array 1, array 2). INTERCEPT (known y's, known x's). RSQ (known y's, known x's).
Step by Step Solution
There are 3 Steps involved in it
1 Expert Approved Answer
Step: 1 Unlock

Question Has Been Solved by an Expert!
Get step-by-step solutions from verified subject matter experts
Step: 2 Unlock
Step: 3 Unlock