

Question: Question 9 3 pts Using the data in the chart below, what is the expected return if you have 50% of the portfolio in Stock
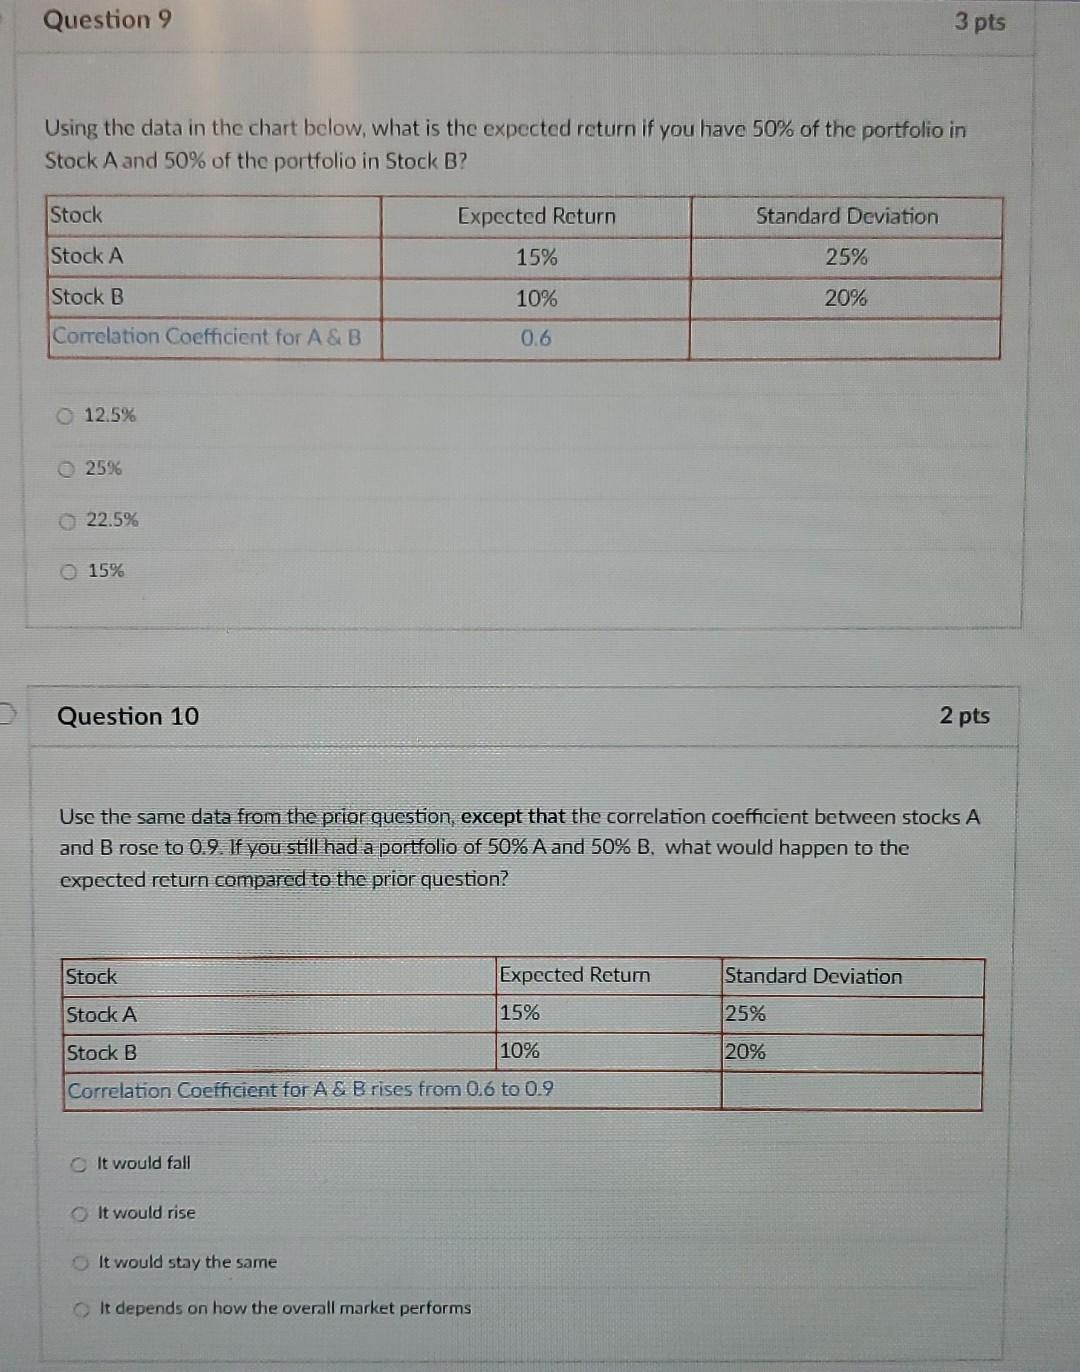
Question 9 3 pts Using the data in the chart below, what is the expected return if you have 50% of the portfolio in Stock A and 50% of the portfolio in Stock B? Stock Standard Deviation Expected Return 15% Stock A 25% Stock B 10% 20% Correlation Coefficient for A&B 0.6 12.5% 25% 22.5% 15% Question 10 2 pts Use the same data from the prior question, except that the correlation coefficient between stocks A and B rose to 0.9. If you still had a portfolio of 50% A and 50% B. what would happen to the expected return compared to the prior question? Stock Expected Return Standard Deviation Stock A 15% 25% Stock B 10% 20% Correlation coefficient for A & B rises from 0.6 to 0.9 It would fall It would rise It would stay the same It depends on how the overall market performs
Step by Step Solution
There are 3 Steps involved in it

Get step-by-step solutions from verified subject matter experts