

Question: Question 9: Using the chart from question 8, create a pivot table and pivot chart to illustrate percentage change in the number of visits after
Question 9: Using the chart from question 8, create a pivot table and pivot chart to illustrate percentage change in the number of visits after 5pm from a base of 25% affects the weighted average cost per unit. Your pivot table and pivot chart should appear like Figure 2.
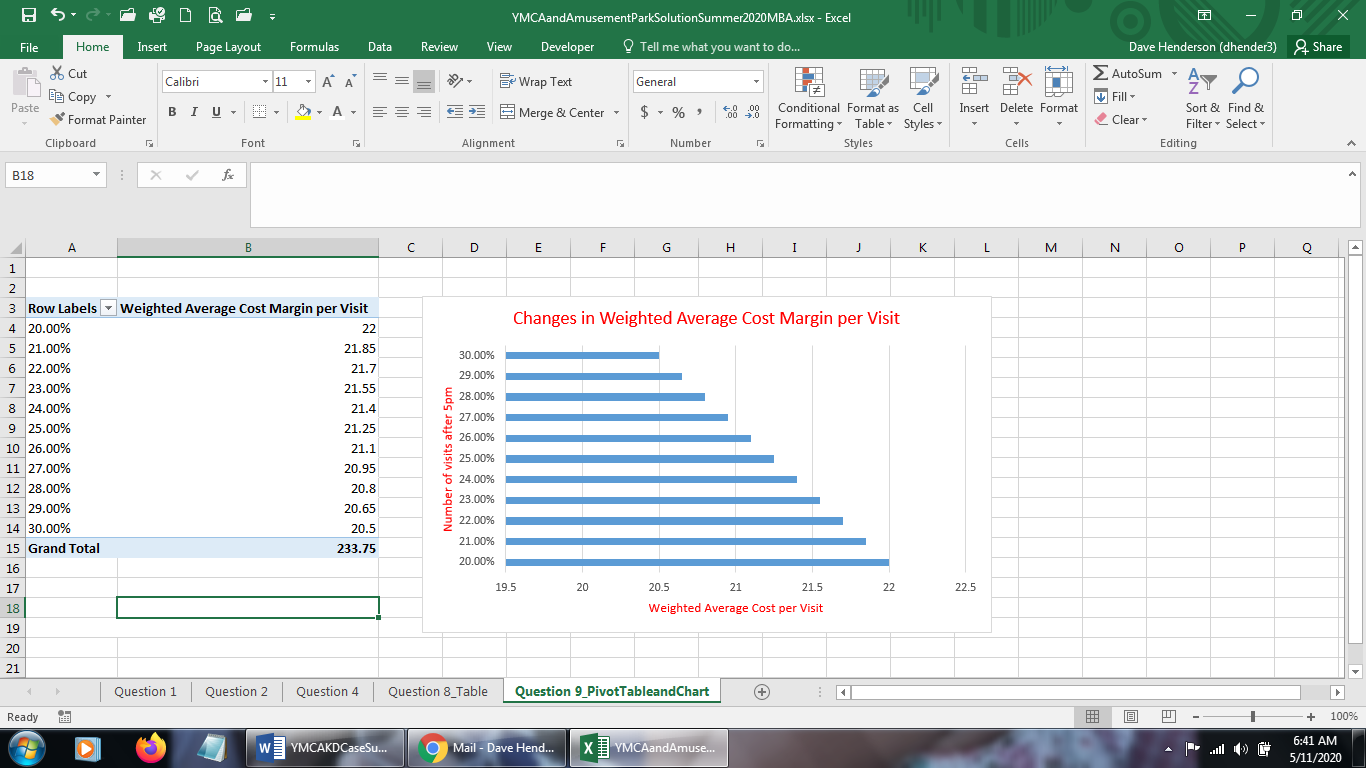
YMCAandAmusementParkSolutionSummer2020MBA.xIsx - Excel X File Home Insert Page Layout Formulas Data Review View Developer Tell me what you want to do. Dave Henderson (dhender3) & Share do Cut Calibri 11 - A A Be Wrap Text General EX AutoSum . A O B Copy Fill - Paste BIU - - A - Merge & Center . $ - % " Conditional Format as Cell Insert Delete Format Sort & Find & Format Painter Formatting * Table Styles Clear Filter . Select Clipboard Font G Alignment Number F Styles Cells Editing B18 X V A B C D E F G H I K L M N O P Q 3 Row Labels |Weighted Average Cost Margin per Visit Changes in Weighted Average Cost Margin per Visit 4 20.00% 22 5 21.00% 21.85 30.00% 6 22.00% 21.7 29.00% 7 23.00% 21.55 28.00% 8 24.00% 21.4 27.00% 9 25.00% 21.25 26.00% 10 26.00% 21.1 Number of visits after 5pm 25.00% 11 27.00% 20.95 24.00% 12 28.00% 20.8 23.00% 13 29.00% 20.65 22.00% 14 30.00% 20.5 21.00% 15 Grand Total 233.75 20.00% 16 17 19.5 20 20.5 21 21.5 22 22.5 18 Weighted Average Cost per Visit 19 20 21 Question 1 Question 2 Question 4 Question 8_Table Question 9_PivotTableandChart (+) Ready + 100% YMCAKDCaseSu.. X 6:41 AM D W IIIIIII Mail - Dave Hend... YMCAandAmuse. 5/11/2020
Step by Step Solution
There are 3 Steps involved in it

Get step-by-step solutions from verified subject matter experts